This is the third post in a multi-part blog series, teaching you the essential concepts of spectrum analysis.
When attempting to analyze or characterize modern telecommunications systems and devices, a spectrum analyzer’s (SAs) ability to measure power over precise sections of spectrum is invaluable. The quality of transmission, nonlinearities, and phase noise of a communication channel can be effectively measured using SA techniques. Two critical measurements of communications standards, such as WiFi, Bluetooth, and cellular standards, is the ability to measure the signal energy leaked into adjacent communications channels, and the range of frequencies that contain the modulated communication signal power. These measurements are known as adjacent channel power (ACP) and occupied bandwidth (OBW), respectively.

Channel power of an FM broadcast band
Adjacent Channel Power
Advanced telecommunication standards allocate slices of spectrum into known channels. These channels have a consistent center frequency and bandwidth. As communications hardware is not ideal, transmitted and received signal energy tends to disperse around the carrier signal frequency. For this reasons, guard bands that separate the channels are also described in the channel definitions. Organizations, such as the Federal Communications Commission (FCC) has developed mandates that prevent the majority of consumer and industrial electronics generating interference— beyond a small acceptable amount— to other frequencies.
For these reasons, while designing and testing a new technology, or evaluating a current radio system, being able to measure the signal energy that disperses, or leaks, into the surrounding channels is valuable in maintaining the standards and regulations. The nonlinear nature of most radio electronics active components leads to spectral regrowth that occurs in the adjacent channels surrounding the channel of interest. So, the ACP measurement performed by an SA may also reveal nonlinear conditions of a transmitter, receiver, or device.
Signal energy from the carrier signal may leak into an adjacent channel due to a combination of effects. Mainly, phase noise, intermodulation distortion (IMD), and the noise level of transmitter or receiver technology. The ability of an SA to measure ACP—dominantly the dynamic range— is also limited by these same performance degrading factors within the SA. A measure of the adjacent channel power to the channel power, or ACP ratio (ACPR) can be simplified as,

Padj and Pch are measured in milliwatts and represent the channel power measured in the adjacent and main channel bandwidths.
Calculating Channel Power
In a digital spectrum analyzer, calculating channel power is the process of integrating FFT bins over the specified channel bandwidth. The power of a given channel is calculated by
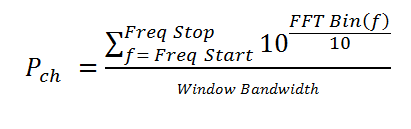
where Pch is in milliwatts and FFT bins are in dBm. The window bandwidth is the equivalent noise bandwidth of the RBW filter used. The RBW filter is also referred to as the window function.
For this calculation to be accurate, a power (rms) averaging or sample detector must be used. In Signal Hound’s Spike software, this means selecting the average detector and power video units. Additionally, for Signal Hound’s SA series analyzers, the spur reject algorithm must be disabled.
Occupied Bandwidth
As coherent and noncoherent distortion effects can cause spectral regrowth and signal energy leaking into adjacent channels, the extremely broad bandwidth communications standards can be interfered with by even small amounts of signal energy leaking into the band. A measurement of the extent of frequencies at which that signal energy spreads, OBW, can be used to maintain standards of communication quality and diagnose degrading communications systems.
For example, a communication standard, 3GPP, may describe OBW as the bandwidth that contains 99.0% of the total integrated power of the signal, centered on the assigned channel frequency. Additionally, this bandwidth may be limited to a few megahertz, and any transmitter technology violating this requirement of the standard would fail compliance. An approximation of the center frequency can be achieved by finding the center point between the highest and lowest frequency of the OBW.
Software Tools for Real-Time ACP And OBW Measurements
Some SA software tools, such as Signal Hound’s Spike Software, come with built in measurement functions that simplify the process of complex measurements, such as ACP/ACPR and OBW. For the OBW measurement, Spike software features a control panel selection that will automatically calculate the occupied bandwidth. The user is only required to input the percent power, in which the occupied bandwidth is calculated.
Watch this video on channel power measurements with Spike
The Spike software provides CP/ACP measurement capabilities through the control panel that only requires a user to input the center-to-center frequency difference between the center channels and adjacent channel, bandwidth of each channel, and number of adjacent channel. The channel power measurement function then computes the integrated channel power in each channel, as well as a comparison of the center channel and each adjacent channel.
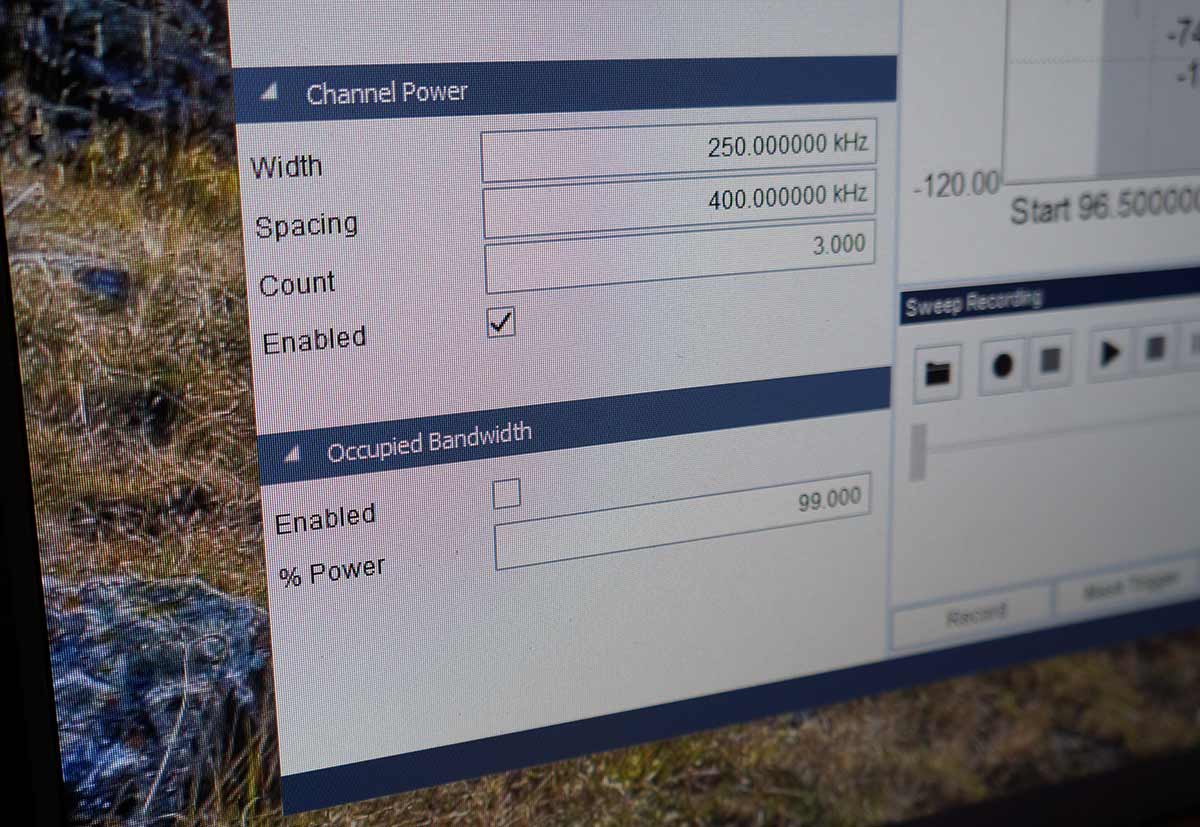
Channel Power and Occupied Bandwidth controls in spectrum analyzer software
Improving Channel Power, Adjacent Channel Power, and Occupied Bandwidth Measurements
A number of strategies exist for making stable CP measurements. Increasing the sweep time or reducing video bandwidth both increase the amount of averaging that occurs in each FFT bin, which can help reduce noise in the measurement. Better ACP and ACPR measurements can be achieved by increasing or decreasing the attenuation of the internal and external attenuators of a SA.
When the noise floor is the greatest contributor to ACP, decreasing the attenuation can reduce the noise floor. When intermodulation products and harmonics are a concern, increasing the attenuation at the input of the SA can reduce the internally generated coherent distortion sources. However, this method sacrifices increasing the noise floor compared to the signal strength. This method can also be used to differentiate between nonlinearity in the SA and nonlinearity in the system being measured. If intermodulation products do not change with corresponding to the increase in the attenuation step, they may be generated outside of the SA.
Increasing the reference level in the Spike software can decrease the noise floor relative to the signal, and decreasing the noise measured in a channel power measurement. On the other hand, increasing the reference level in the Spike software can potentially reduce the nonlinear distortions internal to the measurement system, and enhance the CP, ACP, and OBW measurements.
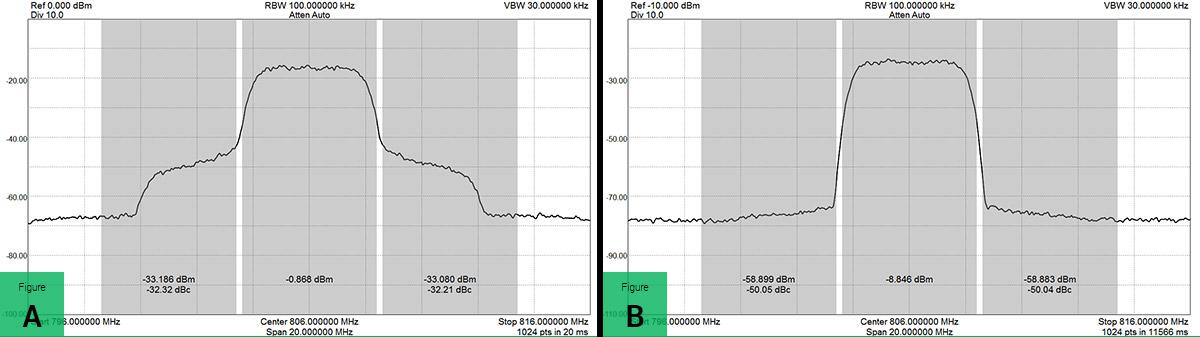
ACP used to characterize amplifier distortion. A: Signal level into amplifier unacceptably high. B: Signal level reduced to decrease ACP to acceptable levels. In both cases, BB60C reference level was optimized for lowest ACP reading.
Further Reading
For an even deeper look into channel power and occupied bandwidth, browse through the links in the references list below. This is an extremely broad topic, and it’s a lot to cover in a single post (in fact, we’ll probably look into this a bit more technically in a future article). Read up on it as much as you can, and get ready for next week’s article: Real Time Spectrum Analysis.
References
- http://www.keysight.com/main/editorial.jspx?cc=US&lc=eng&ckey=459160&id=459160&cmpid=zzfindappnote150
- http://mwrf.com/test-amp-measurement/understanding-adjacent-channel-power-measurements-spectrum-analysis
- http://user.it.uu.se/~ps/SAS-new.pdf
- https://cdn.rohde-schwarz.com/pws/dl_downloads/dl_application/application_notes/1ef77/1EF77_3e_Real-time_Spectrum_Analysis.pdf
- https://signalhound.com/wp-content/uploads/2014/07/Signal-Hound-BB60C-Editorial.pdf
- https://signalhound.com/wp-content/uploads/2014/05/SignalHound_BB60A_MPD_Product_Feature.pdf
- http://www.repeater-builder.com/test-equipment/aeroflex/pdfs/accurate-power-measurements-using-spectrum-analyzers.pdf
- http://cdn.rohde-schwarz.com/pws/dl_downloads/dl_application/application_notes/1ef48/1EF48_2E.pdf
- http://www.ni.com/newsletter/51446/en/
- http://www.arib.or.jp/english/html/overview/st_ej.html
14 Comments
thanks for putting these together
Absolutely. Thanks for reading, and don’t ever hesitate to post any questions you may have 🙂
Is it possible to make a measure of the total average RF power in an entire band such as the FM broadcast band? I’m trying to do some RF research for my PhD thesis and I need to measure the power in a service band like the entire FM band, AM, DTV, Cell and AM.
Thanks
David,
Yes. With the BB60C (or the SA44B when the input is confined to 20 MHz span and spur reject off), you can set channel power to anything (up to your span) and get a good measurement of the total power in that region of spectrum. If the measurement jumps around, decreasing video bandwidth will smooth it out (make sure your detector is set to average power).
Does channel power change as a function of the resolution bandwidth used during the measurement? If you have a CW signal in the channel and measure it with two different resolution bandwidths then the FFT bin value would be the same since the power of the signal is completely contained within the bin. Using your equation for channel power would result in two different answers since the window bandwidths are different.
Hi Jeff,
Good question. Channel power would not change depending on RBW. Generally the window bandwidth, or “Equivalent Noise Bandwidth” (ENBW) will not change on RBW. The ENBW is usually fixed and tied to the window function you use. Our products use flat-top, Nuttall, and Gaussian window functions.
Wiki has a great article on window functions and even has a section on their use in spectrum analysis.
https://en.wikipedia.org/wiki/Window_function#Spectral_analysis
If you have some follow up questions, let me know.
Regards,
A.J.
How would you change RBW without changing the ENBW? For a given window type wouldn’t both depend on the number of FFT bins? If the sample time were doubled wouldn’t the RBW and ENBW be halved? You would sum over twice as many bins, but there would still be only one bin with any significant amount of power.
Hi Jeff,
The reason this works is because the output of FFTs in spectrum analyzers are normalized. In essence this amounts to dividing each output FFT bin by the size of the FFT. This is necessary due to Parseval’s theorem, which states simply that the energy into an FFT is equal to the energy out. If you increase the size of the FFT, then the energy into and out of the FFT increases, and needs to be scaled out for us to measure the amplitude of the spectrum. Therefore, assuming the CW signal you described, no matter the size of the FFT, the output power should remain the same after scaling. It might also be easier to think of this disregarding the window function, when ENBW = 1. With no window, RBW = SampleRate(I/Q) / FFTSize.
I hope this answers your question. Let me know if you have follow up questions.
Reference: https://www.google.com/?gws_rd=ssl#q=fft+normalization
Regards,
A.J.
Is the spur reject algorithm in the Spike software? If I’m using the API I don’t have to worry about it, right?
Spur reject can be enabled/disabled in both Spike and the API. Let me know if you have follow up questions.
Hiii….
how to know FFT bin value, there is any measurements way???
can some one explain clearlly window Bandwidth???
Thanks……
The term often used in literature is the equivalent noise bandwidth or ENBW. If you search for “Window function equivalent noise bandwidth” you will find more information on the subject.
Thanks for your excellent summary.
Amateur Radio transmissions are regulated in Germany re. bandwidth by BNetzA. The rule that has been set up is this: „ Occupied bandwidth is the bandwidth defined by occupation of 0,5% of mean power from the used channel which is distributed below and obove of the uses channel” I have a hard time to translate this into my OB measuremants …
In other word: the intended bandwidth (used channel) in SSB for example is 2700Hz. Occupied bandwidth ist defined by the frequency spectrum below and above this channel which represents 0,5% of the mean power used.
Does this simply mean you have to measure the power by setting OB at 99,5% ?
Any suggestions are appreciated. Thanks!
To all of you HNY – and stay healthy in these bizarre times!
Klaus,
If you were to set the occupied bandwidth measurement in Spike to 99.5%, it would calculate the bandwidth where 0.25% of the total integrated power is below the channel and 0.25% of the total integrated power is above the channel. I believe the usage of the term “mean power” in your definition simply means you will want to use the RMS detector, which in Spike is the Power/Average settings in the Video Units/Detector controls.
See this FCC document, on page 3, that has similar phrasing and a description on how to setup a measurement for this. I think this is a very close parallel to your situation.
https://apps.fcc.gov/eas/comments/GetPublishedDocument.html?id=203&tn=586886#:~:text=1%20Section%202.202(a)%20of,radiated%20by%20a%20given%20emission.
Based on the quote you provided, it does sound like you would want to set the OCBW to 99.5% instead of 99%.
Hopefully this helps!
2 Trackbacks and Pingbacks