This is the second post in a multi-part blog series, teaching you the essential concepts of spectrum analysis.
A measurement on a spectrum analyzer (SA) is taken by configuring, often through software, several key measurement parameters. Many spectrum analyzers have a default setting, along with adjustable center frequency, bandwidth, and power levels. However, not all signals can be easily deciphered with the default SA settings. In these circumstances, adjusting the measurement parameters may reveal more significant signal details. Other tools provided by the SA software, such as markers, triggers, traces, and modulation tools, enable sophisticated features that remove human error and perception issues from tracking and recording vital signal information. These features combine to deliver an extremely versatile RF/Microwave measurement tool that is a mainstay of test application from the field to the lab bench.
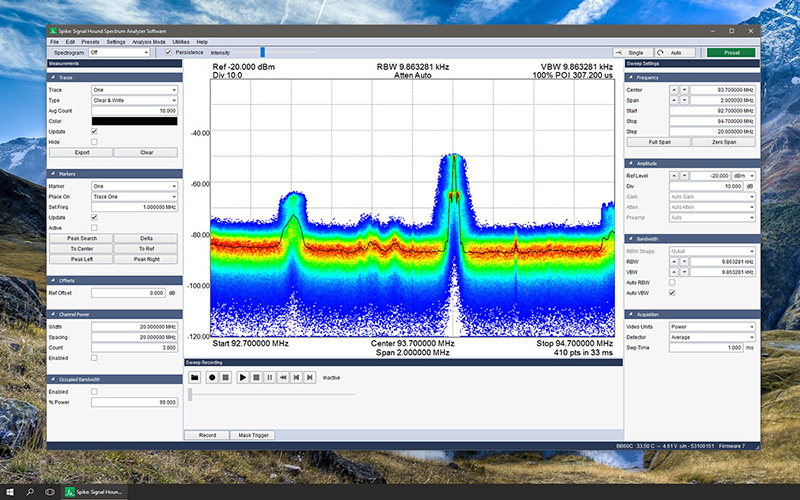
Spectrum analyzer software running on a PC
How To Configure Spectrum Analyzer Measurement
The first step in configuring a SA measurement, is to decide the range of frequencies of interest. This generally depends upon the signals from the device under test (DUT), or the range of spectrum that is being monitored. The measurement bandwidth, or range of frequencies from the start to the stop setting, can be any range within the operating frequency range of the SA. If the measurement bandwidth is beyond the instantaneous bandwidth of the SA, then there will be a delay in updating the signal information, as the instrument sweeps across the larger measurement bandwidth range. The measurement bandwidth can be configured by specifying a start and stop frequency, or the center frequency and span.
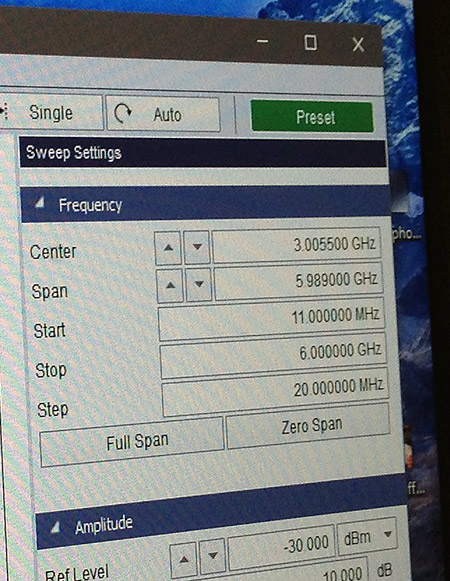
Frequency controls in spectrum analyzer software
Resolution and Video Bandwidth
Depending upon the complexity and resolution needed to detect the signals and frequencies of interest, the RBW can be adjusted to illuminate the details of the signal powers at more distinct tones. Lower RBWs provide more detailed sweeps with a lower noise floor, at the cost of a slower sweep speed, while larger RBWs provide faster and less detailed sweeps. In addition to RBW, the VBW can be used to reveal signal information that may be hidden by the noise in the system. Reducing the VBW acts as a low pass filter, smoothing the amplitude variations of both the signal and the noise floor.
The degree of smoothing is a ratio of the video to resolution bandwidth. As with RBW, lower VBWs increase sweep time. RBW and VBW settings are especially important when measuring low level continuous wave (CW) signals in the presence of a large signal, such as spurs from a phased locked loop (PLL) or intermodulation products. By decreasing RBW to put the noise floor—at least 10 dB below the signal of interest—and then decreasing VBW to smooth out the remaining noise, these signals are easily measured.
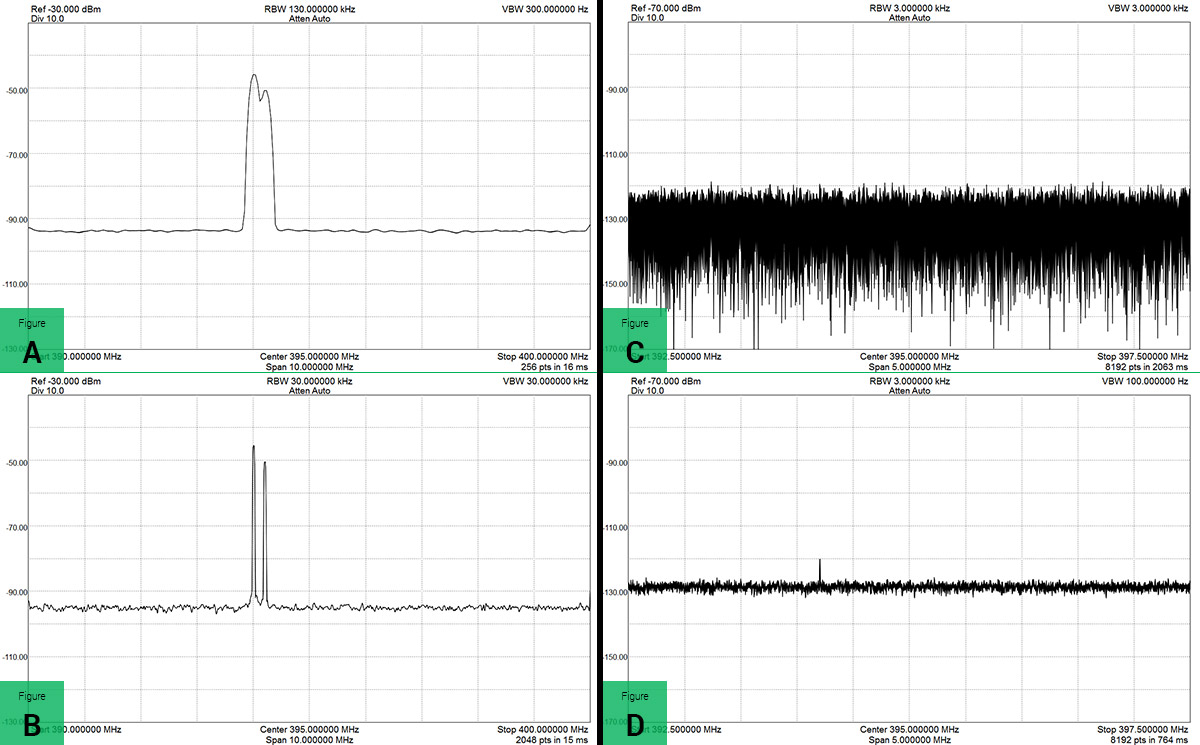
A: Large RBW does not reveal two distinct tones. B: Lowering the RBW reveals two distinct tones. C: Noise floor with VBW equals RBW. D: Lowering VBW reduces the peak-to-peak noise revealing tone.
Gain, IF Gain, RF Attenuation, And Power Level
Depending upon the power level of a signal, signal strength can influence many internal settings of a SA. These settings include the intermediate frequency (IF) gain, the RF attenuator level, the RF gain, and power level of the display. The first component a signal encounters when entering a Signal Hound SA is the RF attenuator. This setting can be increased to measure high power RF signals and improve linearity, or decreased, to improve sensitivity to low level signals.
Additionally, after the RF attenuator, an RF preamplifier can be used to increase the sensitivity of low power signals. This will also decrease the linearity of the SA input, resulting in higher intermodulation products, and reducing the amplitude of the maximum signal level that can be accurately measured. Generally, a compromise between sensitivity and linearity is best. The Spike software automatically selects attenuator and amplifier settings according to the selected reference level, selecting a compromise between linearity and sensitivity to optimize dynamic range for a signal 0-20 dB below the reference level.
Additionally, after the downconverter mixer stages, the amplifiers controlled by the IF gain setting can be used to increase or decrease the signal strength of the frequencies within the bandwidth of interest. Once again, the Spike software will automatically control these settings. But, an experienced user may wish to manually override these settings for some types of measurements. The Signal Hound BB60C typically uses fixed IF gain, but the USB-SA44B has variable IF gain.
What Features Are Available With Spectrum Analyzers
Spectrum analyzers offer a number of fundamental measurements, which can be valuable in interpreting and analyzing complex signals and systems under test. For example, the color and behavior of several traces can be configured by the user. Trace averaging and min/max hold are the two most common trace measurements. Trace averaging is another process for smoothing the output by averaging together several sweeps on a point-by-point basis. Min and max trace features hold the minimum and maximum values on a point-by-point basis respectively.
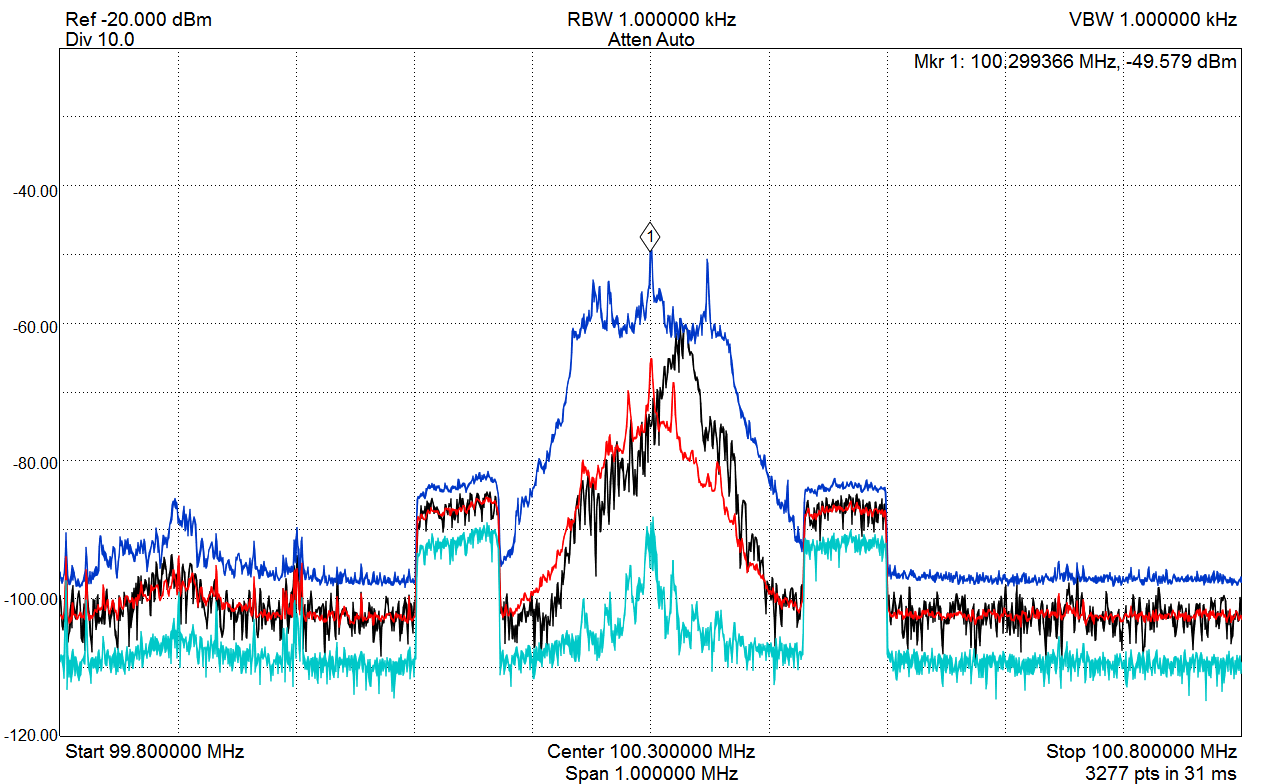
Configuring multiple traces to monitor an FM broadcast transmission
Markers that indicate the frequency and power level at a specific point can be placed on the display. These markers are useful for detecting changes in a signal, or indicating signal measurements of interest, while collaborating or documenting results. Basic arithmetic operations can be performed on markers—usually through the marker delta function—simplifying relative measurements. Markers can easily be added and changed, generally with mouse-clicks or drop-down menu functions.
Triggers are one of the most versatile features of a SA, as they can be used to ensure that the EM energy captured is the signal of interest. There are many simple and advanced features of trigger, from a simple rising-edge or falling-edge trigger, to a complex limit line configuration. External triggers can also be engaged through an external trigger input port, and power-level triggers are also accessible in most SAs. The trigger options are usually available in a drop-down menu, and can often be adjusted by clicking and dragging on the screen, or with manual input.
Further Reading
The intention of this article is to give you a basic understanding of the essential elements of operating any spectrum analyzer device. Next week things will get a bit more specific as we dive into channel power & occupied bandwidth. Until then, feel free to hit us up with any questions or comments below, and glance through the reference materials below for even more information.
Oh, and if you missed last week’s post, Introduction To Practical Spectrum Analysis, don’t forget to read it too.
References
- http://www.keysight.com/main/editorial.jspx?cc=US&lc=eng&ckey=459160&id=459160&cmpid=zzfindappnote150
- https://www.eecs.harvard.edu/~htk/publication/2002-globecom-cheng-kung-tan.pdf
- http://user.it.uu.se/~ps/SAS-new.pdf
- https://cdn.rohde-schwarz.com/pws/dl_downloads/dl_application/application_notes/1ef77/1EF77_3e_Real-time_Spectrum_Analysis.pdf
- https://signalhound.com/wp-content/uploads/2014/07/Signal-Hound-BB60C-Editorial.pdf
- https://signalhound.com/wp-content/uploads/2014/05/SignalHound_BB60A_MPD_Product_Feature.pdf
- http://www.ni.com/white-paper/4278/en/
- http://www.ni.com/white-paper/3983/en/
- http://www.radio-electronics.com/info/t_and_m/spectrum_analyser/fft-analyzer.php
- http://electronicdesign.com/test-measurement/zero-span-made-simple
- https://www.youtube.com/watch?v=Ffhs9Ny03lM
- http://literature.cdn.keysight.com/litweb/pdf/5965-7009E.pdf?cmpid=zzfind8-hints
- http://www.ztecinstruments.com/zconnect/wp-content/uploads/2010/09/AUTOTESTCON_2010_Presentation-1.pdf
- http://electronicdesign.com/test-amp-measurement/fundamentals-spectrum-analysis
9 Comments
Looking forward to next week, thanks for putting these together!
Sounds great Alex… glad you’re enjoying them! We’ve got a long list of upcoming articles so you’ll definitely be seeing more.
Aargh…. now I have to put a Signal hound on my Xmas list 🙂
Hi Cory
Does Spike have a demo mode that could be used along with some of these blogs?
Maybe provide a sample capture to demonstrate the items discussed.
Dec
It doesn’t have a demo mode, but when I mentioned this to our developer he mentioned that something like this was already on his mind. It definitely generated an interesting discussion here this morning… so stay tuned.
cool.
If there’s one thing I think I under utilize its a spectrum analyzer, I’m sure I could get more out of them than I do but just don’t get the time to play.
These blogs help out by reviewing the basics and hopefully more of the test/analysis capabilities.
Having Spike with a demo mode, even if it is restricted feature wise, that can follow these blog items would be a great training aid.
Hello, are you planning to build a spectrum analyzer up to 24.6 GHz?
It would be really useful for many radar applications.
Regards
guidelines how to use sweep function having measured frequencies and average power(channel power)?
Like CF 300kHZ, 20 MHZ….2.8GHZ
average Power when device under test in open condition to noise
average power when device isolated from noise
goal is to determine SNR of the noise
Hello Alex. Please feel free to post this question in our forums, or email support@signalhound.com with specific questions. Thanks!
1 Trackback or Pingback