This is the first post in a multi-part blog series, teaching you the essential concepts of spectrum analysis.
From browsing the internet on your smartphone to surviving the cramped seating arrangement of a modern airliner, RF and microwave electromagnetic (EM) signals enable communication of information for everything from public safety to social media. The devices that leverage the EM spectrum to share and exchange information must be rigorously tested to ensure proper and non-interfering operation. Additionally, interference and environmental factors in the EM spectrum can harm or prevent operation of these devices. Thus, the ability to measure RF and microwave signals is a necessary tool in understanding how communications signals are being transmitted, and how best to receive them.

RF and microwave signals carrying useful communication information, or even disruptive interference, are transmitted and received by billions of electronic devices around the world. Real time spectrum analysis enables a measurement of these signals and an understanding of the environment in which modern communications equipment must operate.
Why Analyze The EM Spectrum Anyway?
Communication signals are carried by EM waves traveling through our atmosphere, generally, from the hundreds of kilohertz to many gigahertz in frequency range. In order for these waves to carry communication signals, transmitter electronics that modulate a data stream on the carrier signal are necessary. In reception of these communication signals, the receiving electronics need to be able to demodulate and decipher these data streams. For radio receivers—like the ones in smartphones—this process can be performed by dedicated electronics.
However, if knowing how well communications signals are being transmitted and received is desirable, a method of measuring and recording these radio frequency (RF) signals is necessary. This analysis can be done in order to determine how well a component or device is functioning, or to analyze the EM activity in the operating environment. Other applications include monitoring the EM spectrum for malicious activity, or diagnosing and predicting equipment failures.
What Is Spectrum Analysis And How Is It Helpful?
Technology that enables the measuring of RF signals over a range of frequency and power is known as spectrum analysis. A common implementation of spectrum analysis is to sweep a highly sensitive power detector over a range of frequencies—a spectrum analyzer (SA)—while recording the results. This method produces a plot of the power levels vs. frequency, using a certain bandwidth of the receiver.
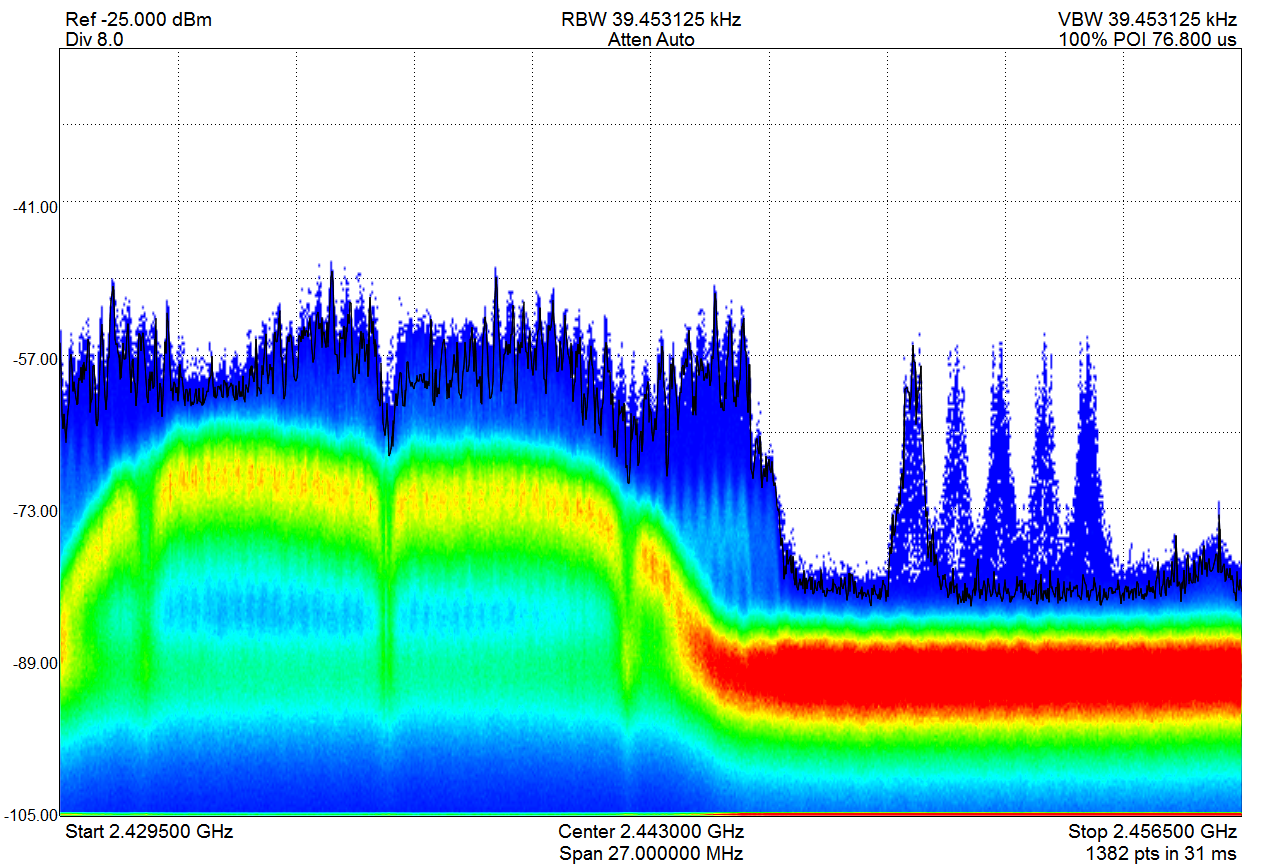
Wifi and Bluetooth, microwave communications standards, coexist in the unlicensed 2.4 GHz industrial, scientific, and medical (ISM) band.
How Does Modern Spectrum Analysis Work?
In order to analyze communication signals, a modern SA requires the ability to rapidly capture the signals entire bandwidth and effectively process this information. However, the receiver of a SA has a finite bandwidth, in which the receiver can accurately process RF signal information. Also, a SA is limited by the processing power that enables the device to convert captured RF signal data into useful frequency domain plots. To overcome this, a SA captures a series of digitized samples of time domain communication signals, which are processed by Fast Fourier Transforms (FFTs) and converted into concatenated frequency domain sweeps.

Simplified Spectrum Analyzer Block Diagram
However, the capture time, or signal acquisition time, influences the resolution bandwidth (RBW) of the resulting plot. A longer acquisition time or a more capable computer can result in a larger FFT and smaller RBW, where each bin represents a narrower segment of the spectrum. The processing will produce a much more detailed and accurate representation of a signal. Adjusting the RBW to fit the type of signal desired is a compromise between the need for high resolution signal data and the speed of acquisition and processing.
A key function of a modern SA, known as a digital intermediate frequency (IF), enables much greater selectivity, accuracy, and speed over prior analog IF methods. Digital IF technology, utilizing ADCs, analog/digital filtering, and FFTs, greatly improves a spectrum analyzer’s capability.
Additionally, a video bandwidth filter (VBW) can be leveraged to smooth the amplitude of the signals. Modern digital signal processing enables the simulation of log, power, or voltage detectors. Configuring the VBW filter in different ways enables several measurement techniques. For example, the power detector smooths the RF spectrum without affecting channel power. The log detector emulates a traditional spectrum analyzer, and the voltage detector is ideal for some amplitude modulated signals. Additionally, video averaging may be applied to average many sweeps together, to even further reduce the peak-to-peak noise.
Further Reading
This article is only a quick glimpse into spectrum analysis; future posts will be more in-depth. Be sure to check back next week for part two of the series: Spectrum Analyzer Basics. In the meantime, read through links in the section below so you’re ready for next week!
References
- http://www.keysight.com/main/editorial.jspx?cc=US&lc=eng&ckey=459160&id=459160&cmpid=zzfindappnote150
- https://www.eecs.harvard.edu/~htk/publication/2002-globecom-cheng-kung-tan.pdf
- http://user.it.uu.se/~ps/SAS-new.pdf
- https://cdn.rohde-schwarz.com/pws/dl_downloads/dl_application/application_notes/1ef77/1EF77_3e_Real-time_Spectrum_Analysis.pdf
- https://signalhound.com/wp-content/uploads/2014/07/Signal-Hound-BB60C-Editorial.pdf
- https://signalhound.com/wp-content/uploads/2014/05/SignalHound_BB60A_MPD_Product_Feature.pdf
- http://www.ni.com/white-paper/4278/en/
- http://www.ni.com/white-paper/3983/en/
- http://www.radio-electronics.com/info/t_and_m/spectrum_analyser/fft-analyzer.php
2 Comments
Nice idea!
I agree, and I’m looking forward to the rest of the series.
1 Trackback or Pingback