Updates to Signal Hound’s custom applications are ongoing. Our talented engineering team continues to add industry-standard features to both our valuable (FREE) Spike RF analysis software, and the Signal Hound SDK.
Hit the road with Spike’s new RF mapping feature
Recently, our team of software ninjas added an incredible new feature to Spike – RF Mapping.
RF Mapping for drive and walk test solutions are now part of the ever-growing list of free tools included. Earlier this Fall, we surveyed RF professionals about the most important aspects of their needs in an RF Mapping solution. We heard you and applied that feedback to this latest release of Spike.
This new Mapping mode is a game-changer for Spike. It has particular application to Field Techs and Mobile Engineers. The ability to capture and analyze wireless coverage and performance is so valuable in today’s networked world. With your free Spike software and a Signal Hound spectrum analyzer, you are a mobile data analysis hub with everything you need to ensure your systems are operating at peak functionality.
Hit the road with Spike’s new RF mapping software
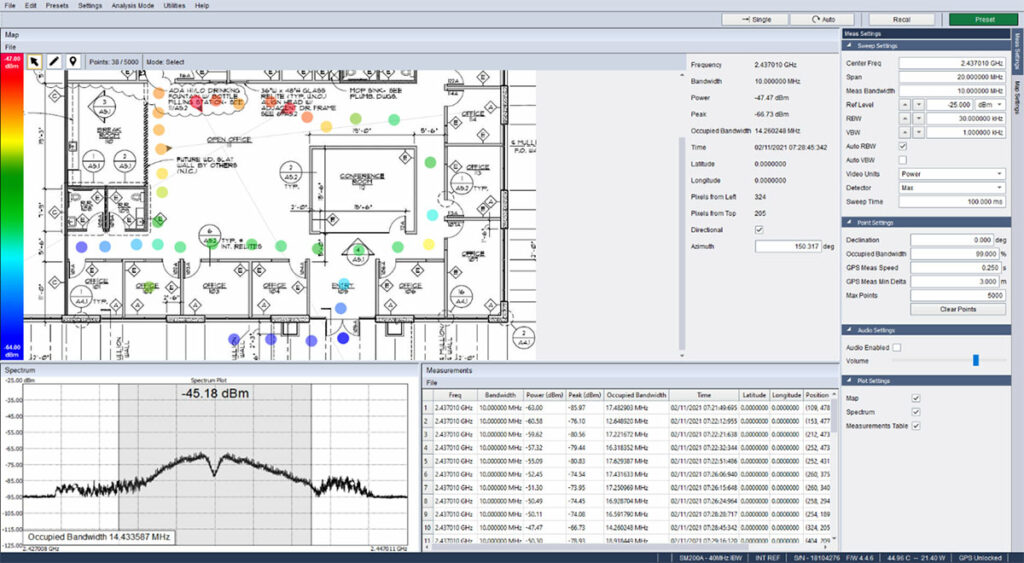
Whether it’s for drive or walk test solutions, testing network coverage, or modeling wireless performance on outdoor installations and indoor DAS systems, Spike’s new RF mapping analysis mode provides the tools for efficiently adding a geospatial data layer to your RF measurements.
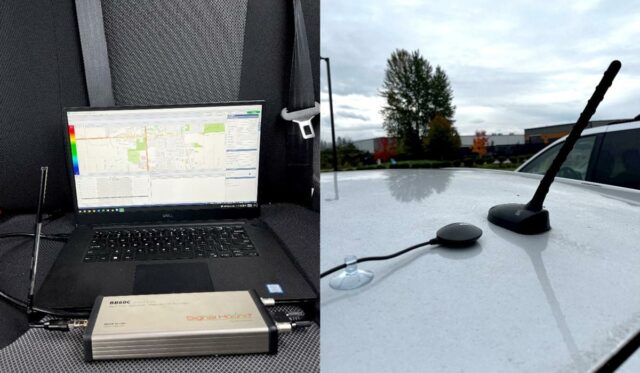
With a Signal Hound spectrum analyzer connected to a computer running Spike, setup is as easy as importing a map, and optionally connecting an external GPS unit, or using the internal GPS of an SM series device.
Measurements can be taken manually by clicking on the map, or automatically when using a GPS receiver based on time or distance travelled, allowing hands-free operation. To make the process even more intuitive and convenient, turn on audio feedback for RSSI, enabling eyes-free operation while driving or walking.
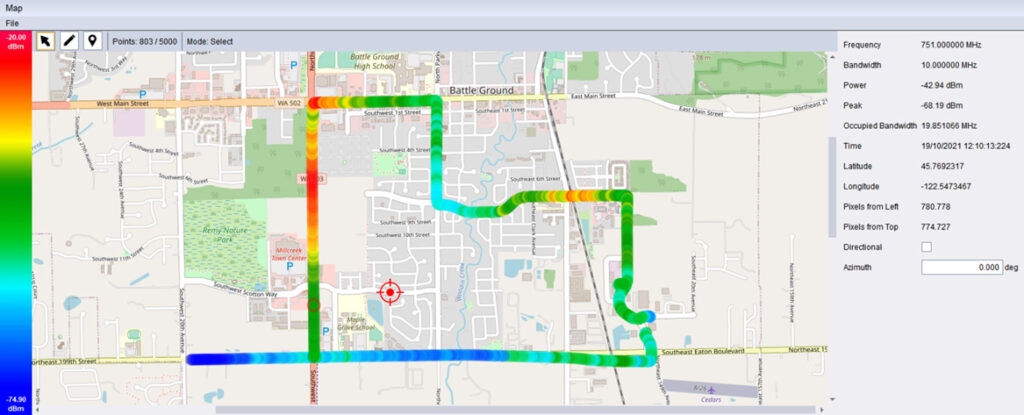
Measurements capture frequency, measurement bandwidth, channel power, peak signal strength, and occupied bandwidth, in addition to time, geographic latitude and longitude coordinates, and an optional direction or bearing. If a measurement has a directional component, a line will be drawn on the map to aid in visually triangulating an energy source.
Points are heat mapped according to their power readings, on an adjustable color spectrum, to maximize useful information at a glance. The azimuth of directional points can be specified by rotating a point with a mouse or trackpad, or entering an angle manually from a compass, with an optional declination adjustment.
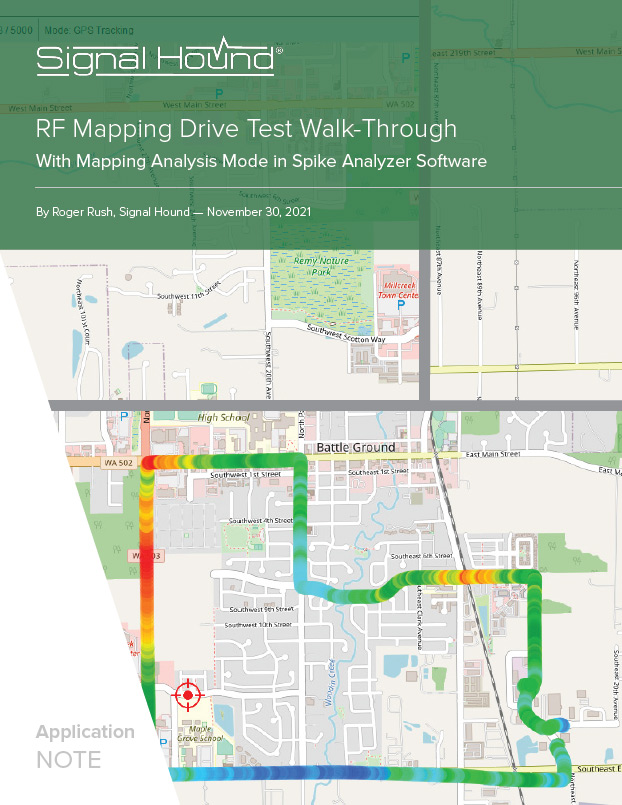
Learn how to perform a signal strength drive test with Spike
Download our walk-through document detailing the set up and configuration of Spike and a Signal Hound spectrum analyzer for mobile signal strength mapping and analysis.
This is a free PDF, no sign-up required.
Mapping works inside, too
Working equally well for outdoor sessions across a wide area around a cell tower, to indoor sessions in a small building for fire radio safety analysis, the ability to import any map gives the user ultimate flexibility in how their measurements are represented geospatially. For indoor mapping, it may be necessary to anchor a measurement only to a position on the image, such as a floorplan.
After data capture in the field, measurement points can be exported as a simple CSV, or in KML format, which can then be opened in Google Earth™ mapping service, with full heat mapping preserved, Google Maps™ mapping service, and other compatible programs.
Sessions preserving maps, measurements and configuration data can be exported on one PC and imported and viewed on another. This enables someone to collect data in the field, and another to analyze it in the lab, with a simple file exchange.
Spectrum analysis and mapping are both dense fields and integrating them in an effective way is challenging. At this intersection, applications that reduce unnecessary complexity are immensely valuable. With Spike, RF mapping is at its simplest and most affordable.
Get it today
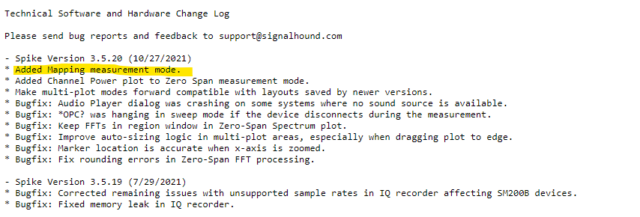
As with all Signal Hound software, the RF Mapping mode is available for free in Spike software. If you have a Signal Hound RF analyzer (SA, BB, or SM series), upgrading Spike to version 3.5.20 adds this new Mapping feature.
Also – New in the SDK – Frequency Hopping I/Q Acquisition for the SM200
Signal Hound also recently introduced frequency hopping I/Q acquisition for all SM200 models.
This feature allows customers to define custom I/Q acquisition lists with up to 1200 unique frequency steps and custom acquisition sizes at each frequency. The SM200 can continuously sweep up to 8333 frequencies per second, allowing targeted I/Q monitoring with high probability of intercept. I/Q samples are timestamped using the on-board GPS.
These new capabilities are available through the SM200 API found in the SDK, available on our SDK download page.

2 Comments
It’s interesting to know technologies that would be able to help field engineers in mapping specific areas so as to determine signal quality. In my opinion, these systems are very important for the management of large venues, especially in events, as well as to have signal coverage and be able to achieve in-building public safety. It would be great if all events are considering these sorts of technological safety precautions.
It will be interesting to test this new feature.
On my wishlist would be a combination of GPS and OBD2 for tunnel acquisation.
Use GPS as long as possible and after that dead counting based on OBD2 from the car OBD2 port.