This is the third and final post in a multi-part blog series where we take a look at a few practical applications of spectrum analyzers.
All wireless telecommunication signals undergo modulation in order to impart a data stream within the RF/microwave carrier. Many modern devices rely on digital modulation techniques in order to efficiently transfer complex information in low-power and robust signal transmission. In order to characterize the transmitters and signal chain devices under these modern complex signal conditions, spectrum analyzers or signal analyzers equipped with vector signal analysis (VSA) software, can decipher many valuable characteristics of digital modulation based systems. Moreover, real-time spectrum analyzers (RTSAs) have the ability to reveal transient behaviors and more deeply characterize the outside signal environment for deeper understanding of a transmission and transmitter/receiver’s performance—all with one instrument.
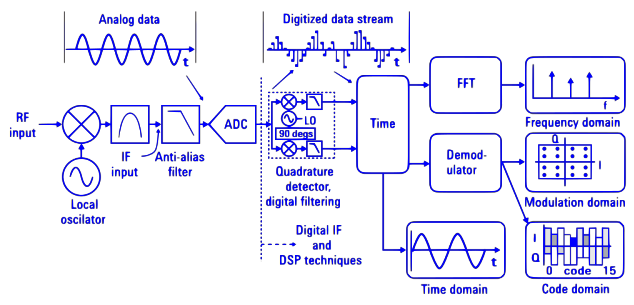
With software-based demodulators, real-time spectrum analyzers can perform valuable signal analysis functions. This includes providing time, frequency, modulation, and code domain information.
Frequency Domain Measurement Benefits of RTSAs for Vector Signal Analysis
The quality of a vector signal analysis depends largely on the quality of the received signal. Barriers to effective demodulation and analysis include poor signal-to-noise ratio (SNR), framing/timing errors, frequency/phase errors, and incorrect symbol rate or bandwidth. To reliably demodulate and determine characteristics of the transmission system or signal environment, a RTSA’s frequency and time domain analysis features can be used to determine the best settings for performing time modulation, and code domain analysis.
Fortunately, RTSAs are rapidly reconfigured through software and digital signal processing techniques, and can perform wideband spectrum measurements for initial signal environment analysis, narrowband spectrum measurements to detect undesirable transient behavior, and vector signal analysis. Wideband spectrum measurements, such as detecting spurs and interference, can prepare an observer with understanding of the best methods in which to test the transmission or transmitting system. The detected spurs and harmonics can be compensated for, and the interferences correctly identified and compensated for. A method that aids with this analysis is the RTSA’s persistent display and waterfall display. Interoperability issues and spectrum congestion can be analyzed with these tools while simultaneously detecting transient spurs.
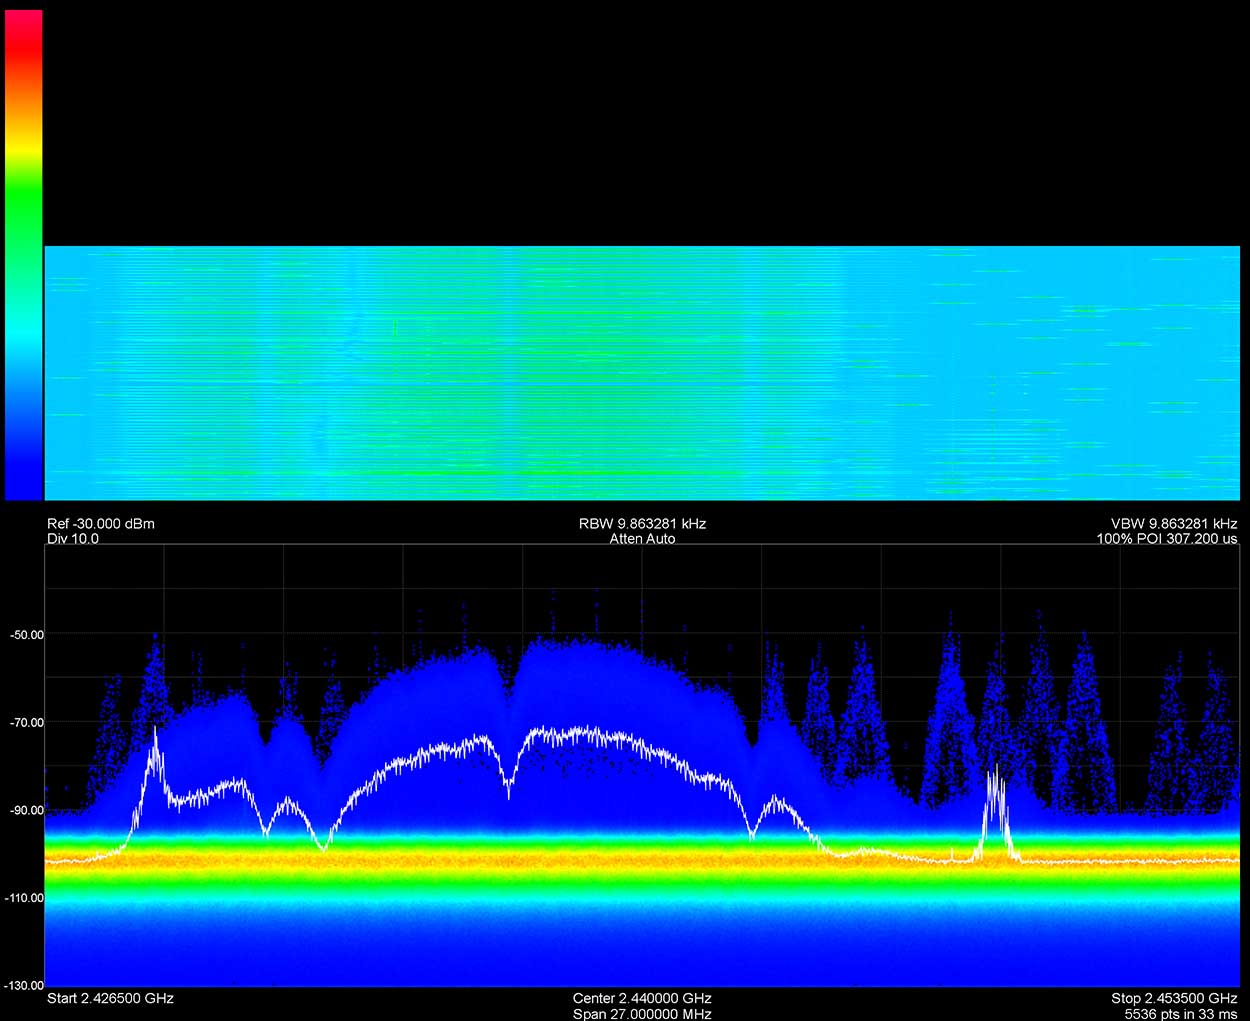
Interference in congested spectrum revealed by an RTSAs persistent and waterfall display in the 2.4 GHz ISM band, can lead to inaccurate digital demodulation.
After wideband measurements are used to hone in on the precise signals of interest, narrowband measurements can be used to better understand those signals and prepare for vector signal analysis. Measurements, especially if they are contained within the instantaneous bandwidth (IBW) of a spectrum analyzer, can be made to accurately describe the signal of interests’ center frequency, occupied bandwidth, power levels, and many signal integrity issues can be discovered at this stage. This could include early detection of any amplitude, frequency, and phase instability, as well as any switching effects, tilt, or ripple.
Pulsed or framed signals can be detected, measured, and recorded for further analysis with zero-span features of a spectrum analyzer. When capturing these types of signals or transient spurs/interference, a RTSA with the ability to configure limit lines can be highly valuable in ensuring that only the signals and signal behavior of interest are measured. Furthermore, when working with signals that leverage dynamic signal power techniques, RF envelope and power versus time (PVT) measurements can also be used to verify some behavioral aspects of these techniques—including digital predistortion (DPD) techniques.

Limit lines can detect transient spurs, as known signals can be used to configure these limit lines around desired waveforms.
Time & Modulation Domain Tools for Vector Signal Analysis
After the initial time and frequency information confirm the signal to be measured, several demodulation settings of the vector signal analysis software tools must be properly configured. Generally, if the modulation type, symbol rate, filter type, and alpha are not matched to the received signals digital modulation, stable digital demodulation measurements are not feasible.
| If the transmitter filter is: | And the receiver filter is: | Then the measurement filter should be: |
|---|---|---|
| Raised Cosine | None | Raised Cosine |
| Root Raised Cosine | Root Raised Cosine | Root Raised Cosine |
| Gaussian | None | Gaussian |
Generally, if the constellation diagram in a VSA display is stable, without rotation, and contains identifiable symbol locations, the correct demodulation parameters were selected. To digital demodulate pulsed or framed signals, correct triggering must first be arranged. After the correct setup configuration is prepared, several demodulation analysis displays can easily be populated by VSA software.
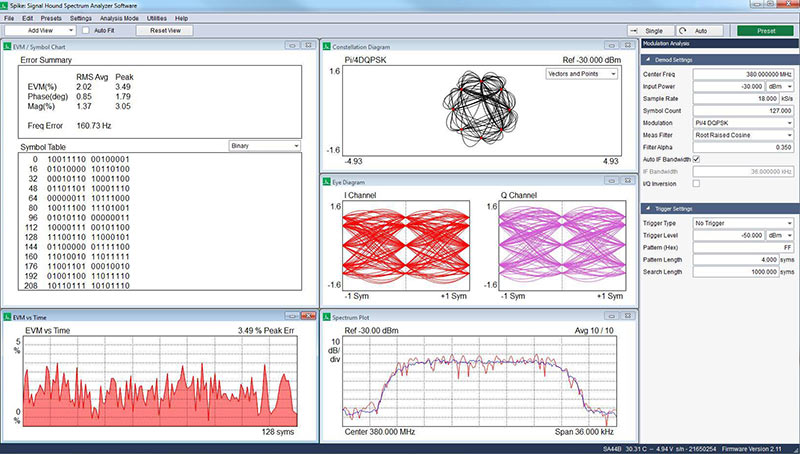
Signal analysis plots, such as Eye Diagrams, Constellation Diagrams, EVM Vs. Time, and others, reveal information that can be used to gauge the performance of a digital signal transmission, transmitter, devices, components, and systems.
| Error Summary Table | Basic digital demodulation analysis, such as an error summary table, can be used to troubleshoot many major signal quality errors and gauge the significance of certain error types. Often the RMS average and peak EVM, phase, magnitude, and frequency error are displayed here. |
|---|---|
| Symbol Table | A symbol table provides the demodulated bits of the input signal in binary or hexadecimal. |
| Error Vector Magnitude (EVM) Vs. Time Plot Or Error Vector Time Plot | The error vector time plot can reveal trends in the EVM over symbol time, such as symbol or frame timing errors associated with power control or interferers. |
| Constellation Diagram | A constellation diagram provides the modulation states and transitions of an input signal in the complex plane, and can reveal the quadrature error, phase noise, amplitude error, and imbalance in a digital signal stream. |
| Eye Diagram | An eye diagram is a visual display of a repetitively sampled digital signal stream, and can reveal information about the phase noise, jitter, clock timing, and skew of the transmission or system being evaluated. 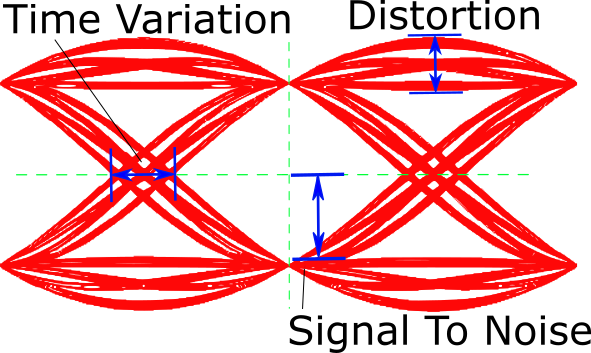 |
References
- http://literature.cdn.keysight.com/litweb/pdf/5990-6997EN.pdf
- http://literature.cdn.keysight.com/litweb/pdf/5990-7451EN.pdf
- https://signalhound.com/sigdownloads/Spike/Spike-User-Manual.pdf
