This is the first post in a multi-part blog series where we take a look at a few practical applications of spectrum analyzers.
There are many cases where accidental or intentional EM interference occurs, which puts even greater burdens on an already crowded spectrum. The ability to capture, analyze, identify, and locate these harmful signals is crucial in ensuring proper operation of cellular, WiFi, GPS, and other telecommunications technology. The onrush of Internet Of Things (IOT) and Machine to Machine (M2M) adoption and the plethora of wirelessly connected devices poses further challenges in deciphering the complex RF spectrum. Real time spectrum analyzers (RTSAs) present a valuable set of features that aid a skilled user in understanding and finding interfering and infringing signals, accidental or otherwise.
Basic Features And Techniques
A SA possess several features that can be leveraged or adjusted to help determine a troublesome signal’s important details, namely:
- Resolution Bandwidth (RBW)
- Frequency Span
- Video Bandwidth (VBW)
- Trace Averaging
- Max Hold Trace
- Peak Detector
The true RTSA advantage comes from the Real-Time-, Instantaneous-, or Useable-IF Bandwidth, which profoundly affects the Probability of Intercept (POI) of an intermittent or digitally modulated interfering signal. This is done by enabling the use of simultaneously parallel RBW windows. For example, a single 27MHz Instantaneous bandwidth the PC can process thousands of RBW segments that were all captured simultaneously.
RBW, Frequency Span, And Probability Of Intercept (POI)
Lowering the RBW will increase the frequency resolution of the RTSA, while also increasing the signal-to-noise ratio (SNR) on the display. Though this feature will allow for non-noise like signals to be more easily identified and located with a directional antenna, any reduction in the RBW will also increase the burden on the PC. Reducing the RBW could reduce the sweep speed if the PC’s computing resources are fully utilized. Hence, when decreasing the RBW it may also benefit the user to reduce the frequency span so that the signal of interest is centered and occupied roughly 50% of the span bandwidth.
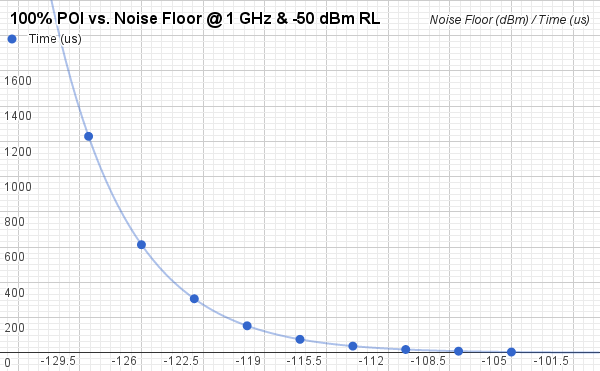
Another factor to consider when adjusting the RBW, is that the probability of intercept (POI) time duration is affected by the RBW value. If a signal’s energy is entirely contained in the time window of the RBW, then the signal’s amplitude will be represented accurately. Otherwise, a shorter signal may be displayed without a high level of amplitude accuracy. As the BB60D has truly overlapping FFTs, this RTSA is capable of capturing signals shorter than the time window, albeit not with perfect amplitude accuracy. Not all RTSAs are capable of this, as they may lack overlapping FFT’s.
Video Bandwidth And Trace Averaging
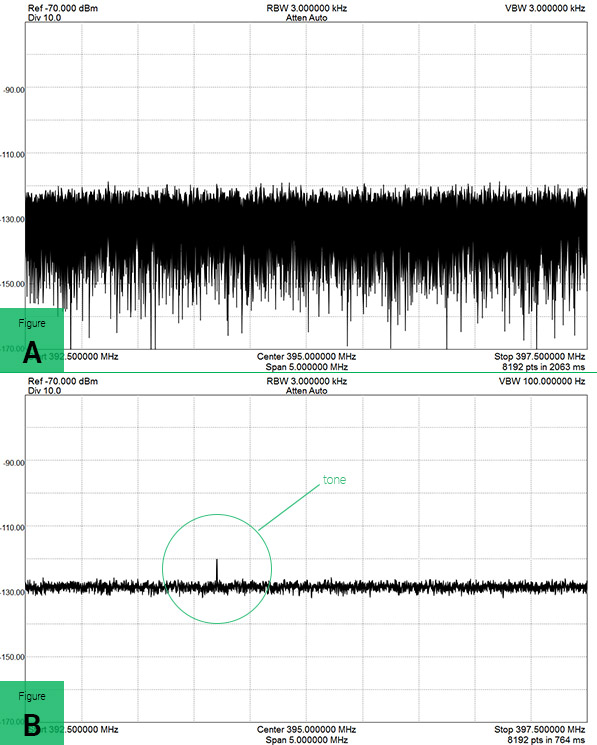
If there are rapid power variations in the frequency band around the signal of interest, reducing the VBW or initiating Trace Averaging will help reduce the variations. Reducing the VBW will help in “smoothing” the displayed signal, possibly revealing signals masked within the noise floor. Typically, unless additionally smoothing is needed the VBW will equal the RBW. Generally a second choice, Trace Averaging takes an average of a number of sweep traces, which often only displays more persistent signals.
Max Hold Trace And Peak Detector Settings
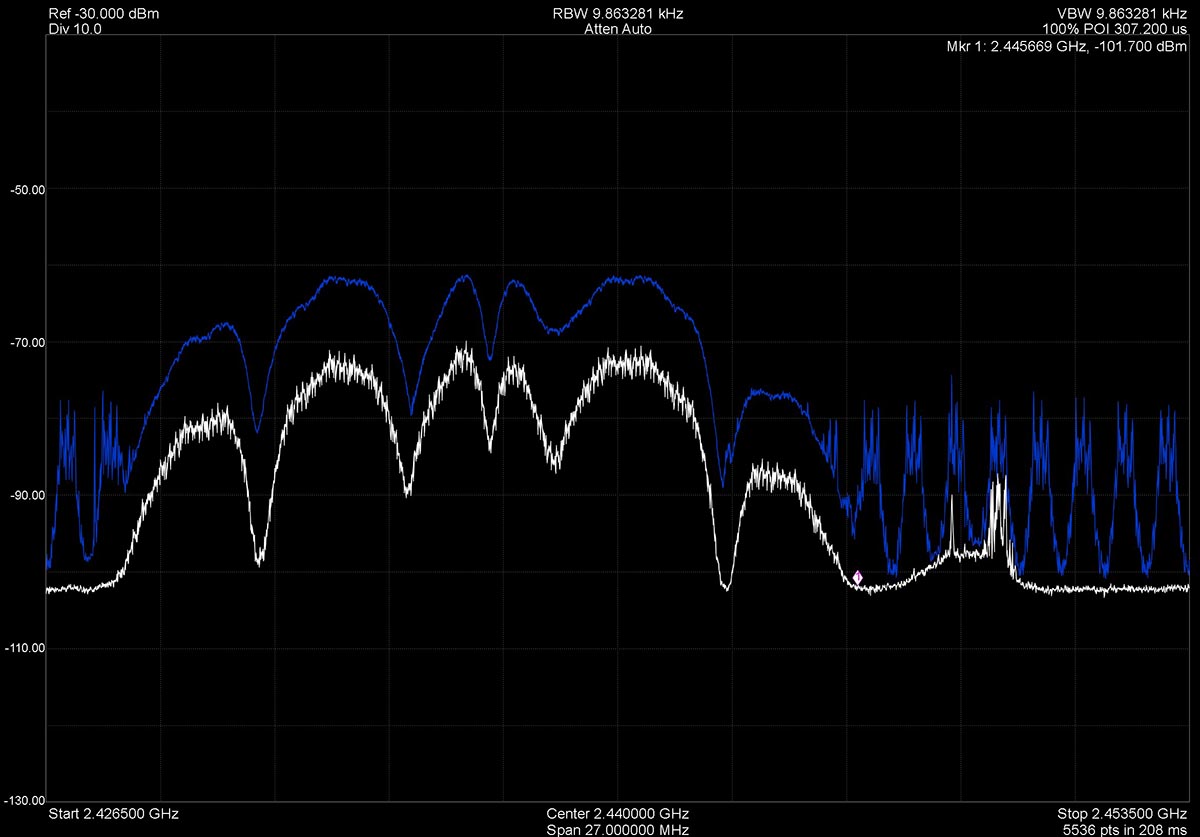
Using multiple traces, where one trace is the Max Hold trace and another the standard trace can help to identify pulsed or low-duty cycle signals. The Max Hold trace will display only the maximum power signal trace for the refresh time period, while the standard measurement trace will continue to update. In Signal Hound Spike software, multiple traces can be configured and displayed with clear & write, max hold, and averaging functions simultaneously. Also, when encountering signals of low, medium, or high levels, adjusting the maximum peak detection level to accommodate the signal power of interest can help reveal low levels signals in the presence of high level signals.
Persistent Display
Persistent displaces and waterfall displays use visual indicators to display time and intensity of signals, which enable users to understand the behavior of the RF environment within the sweep range. Persistent displays treat each pixel in a logarithmic power and frequency plot as a “bucket” that increases its intensity based upon the number of sweeps in which signal energy is contained in that bucket. Often, color gradients distinguished the intensity, and to mimic old SA phosphorus displays, a decay function is applied to the pixel. This means that the more frequently a specific frequency and power pixel in the display contains RF energy, in the Spike software, the “brighter” or “redder” that pixel will be.
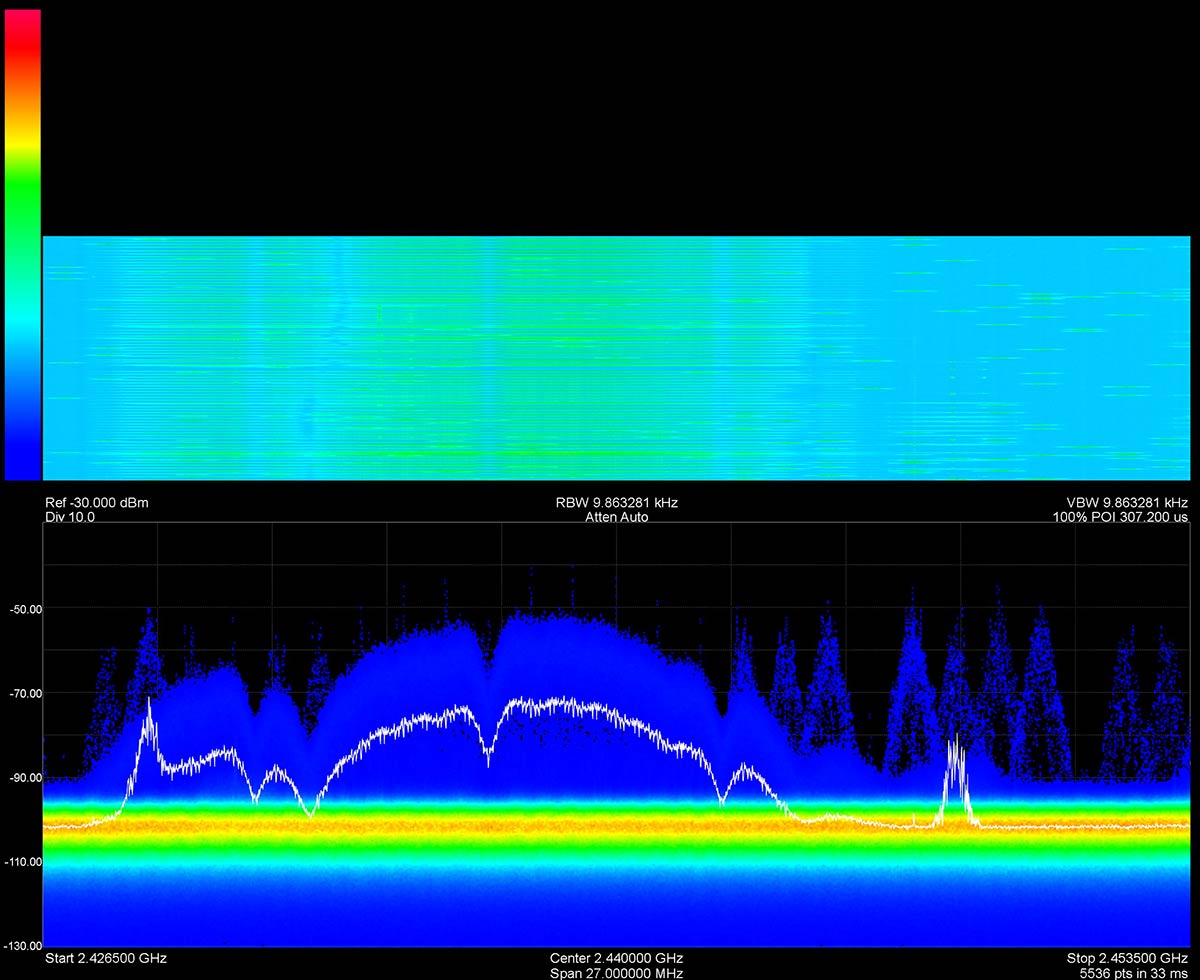
Waterfall Display
A waterfall display is a powerful tool that displays signal power across a frequency range over time. When initiated, the waterfall display generates a line across the frequency spectrum of interest, showing the percentage of time a signal is present as a color gradient. One spectrum time slice line is then stacked on top of the next time slice captured, creating a growing stack of past signal activity varying in color. With this display it is easy to see frequency hopping, periodic, low-duty cycle, pulsed, and persistent signals and analyze their activity over time. Interferers, such as a magnetron activating in a microwave oven, can be observed over time, and their time-domain impact on a frequency band can be determined readily with a waterfall display.
This video shows a waterfall display in action, as presented in our Spike software (the waterfall display is in the top pane of the application):
Record & Playback And Limit Line Functionality
As certain types of interference may be harder to classify in the field, a helpful feature of an RTSA is the ability to record the received signals for future playback and analysis. The software that ships with an RTSA may have the ability to capture signal data, where outside software tools, such as Matlab and Excel, can be leveraged to further analyze the frequency and power data when it is recorded in I/Q data format. In some RTSA software tools, this is as easily done as clicking a record and stop button, just as you would on an audio player.
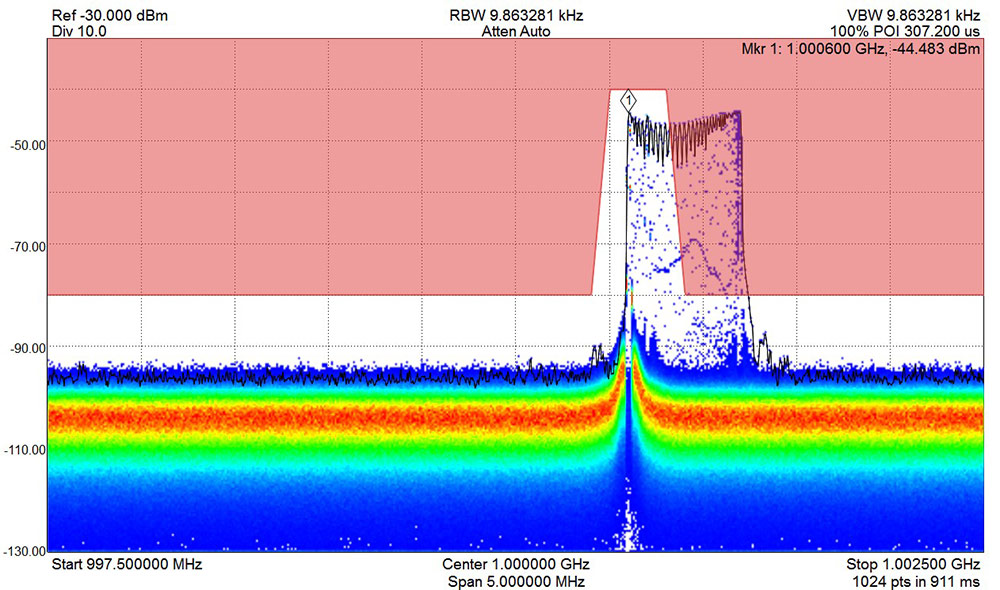
Another valuable feature for capturing elusive signals is the ability to configure limit lines in order to “mask” out an area of frequency and power spectrum and trigger events when a signal falls within the mask area. The triggered event could be a capture image, print screen, display pause, or exporting the captured signal to a CSV file for later viewing and processing.
Further Reading
The capabilities of a real time spectrum analyzer create a valuable tool for “viewing” the signals in your environment and provide a starting point for a deep look into interference issues. As you continue to spend time observing and monitoring the wireless spectrum, you’ll begin to develop a keen sense of where potential interferers lie.
Want to learn more? Check out the links in the list below for even more details on interfering signals and spectrum monitoring.
References
- http://www.sigidwiki.com/wiki/Signal_Identification_Guide
- http://mwrf.com/test-measurement-analyzers/measure-interference-crowded-spectrum
- http://anritsu.typepad.com/interferencehunting/
- http://dl.cdn-anritsu.com/en-us/test-measurement/files/Application-Notes/Application-Note/11410-00849A.pdf
