This is the second post in a series where we take a look at EMI and EMC precompliance using real time spectrum analyzers.
Recent advances in PC-driven USB Real-Time Spectrum Analyzers (RTSAs) have enabled low-cost and efficient EMC precompliance testing and EMI identification with just a few simple tricks. All you would need is an RTSA, a computer, an antenna, a test area, and possibly a near-field (NF) probe set with an amplifier. Some know-how of the compliance standards requirements is also valuable, as well as knowledge on how to configure an RTSA to give you results that you can measure against EMC compliance standards, reliably.
RTSA EMC Precompliance Advantage
RTSAs have many features that can aid with EMC precompliance, such as the persistent display, waterfall display, programmable sweeps, and configurable limit lines. With these technologies and overlapping FFTs, bursting, modulated, or frequency hopping signals can be accurately captured by RTSAs, where a traditional spectrum analyzers may get a low averaging effect and misrepresent signal power or even miss the signal with the peak detector if the duration of the signal is shorter than the attack specification of the detector.
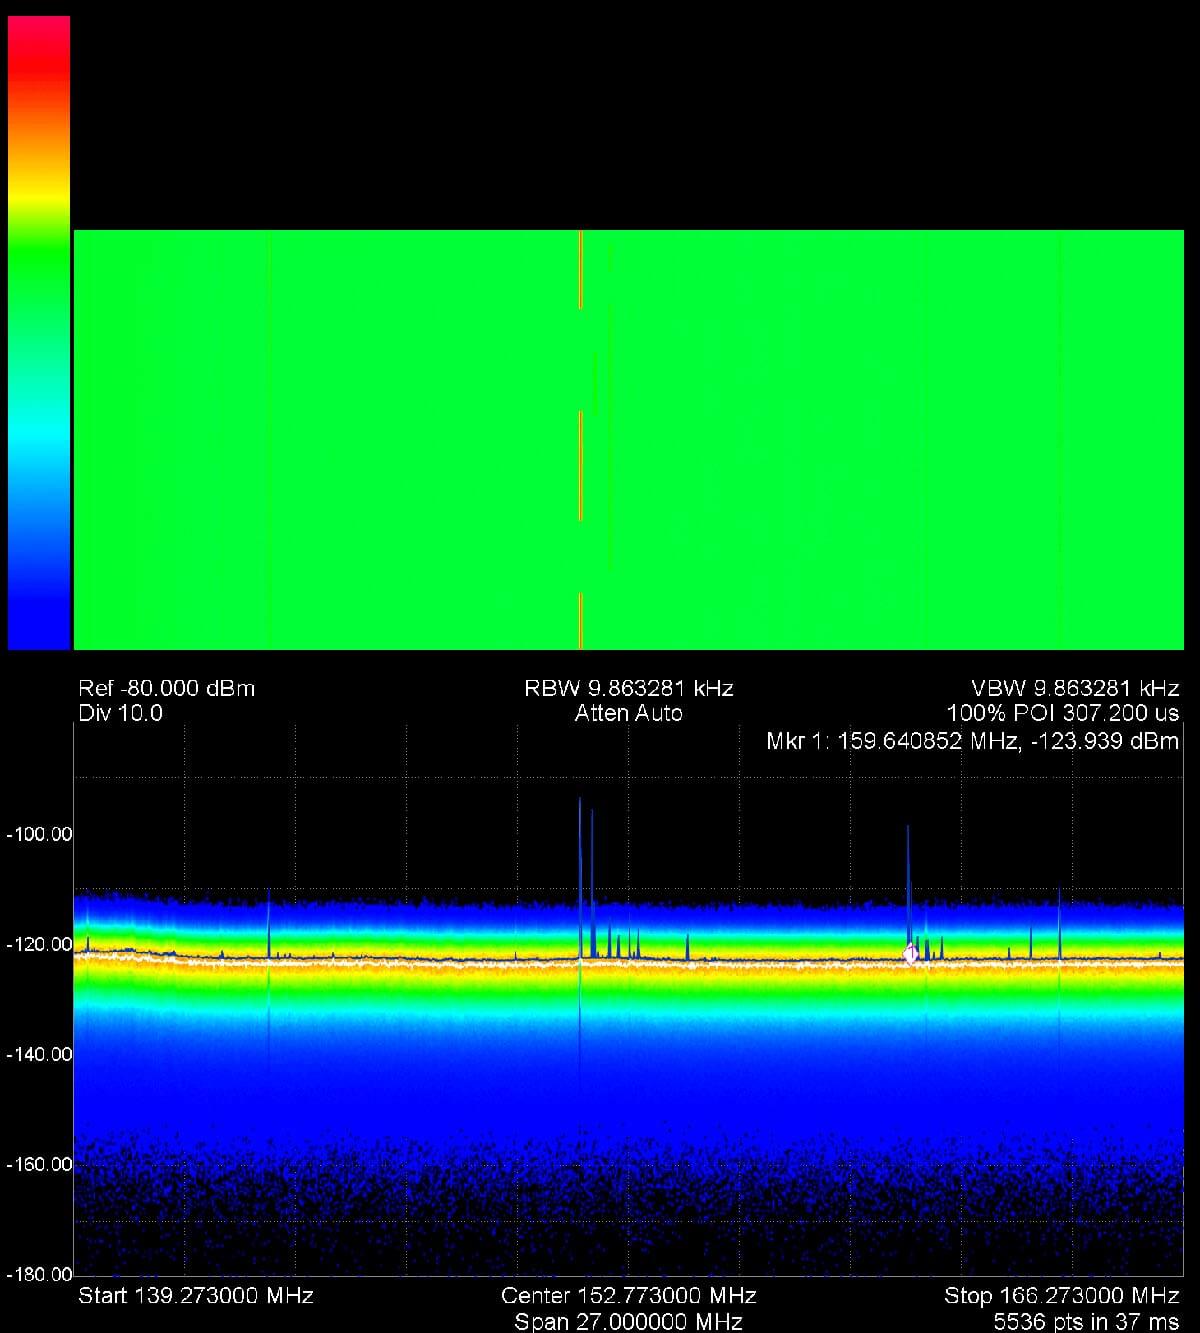
A persistent display with EMC probes can reveal spurious and intermittent spurious activity of a standard USB 2.0 port.
Another advantage of PC-driven RTSAs is the flexibility of the fast fourier transfer (FFT) digitization of data and the ability to process that data on a sophisticated PC software. Custom routines and analysis can be relatively easily implemented with PC-Driven RTSAs, and post-test analysis software can be used to provide deep insights inaccessible in traditional bench-top instruments due to costs and slow update turn around. For example, Signal Hound’s Spike spectrum analyzer software was recently upgraded with an EMC precompliance module, where Signal Hound’s engineers enabled a complex digital quasi-peak detection algorithm, and a suite of common EMC precompliance tools—for free.
Though a low-cost RTSA will not fulfill all of the EMC compliance requirements, they can be very beneficial in EMC precompliance measurements. Specifically, to advance a design to a level of performance where EMC compliance can be performed with confidence. There are several setting requirements by the standards that dictate how an EMC compliance measurement must be made including, frequency, bandwidth, and resolution bandwidth (RBW).
Max Hold & Limit Lines
Over a wide frequency sweep, it is often challenging to locate intermittent spurious signals. One method of providing an idea of where intermittent spurious behavior occurs is leveraging a Max Hold trace. Once areas of spurious activity are identified, further analysis can be done with real-time spectrum analysis tools.
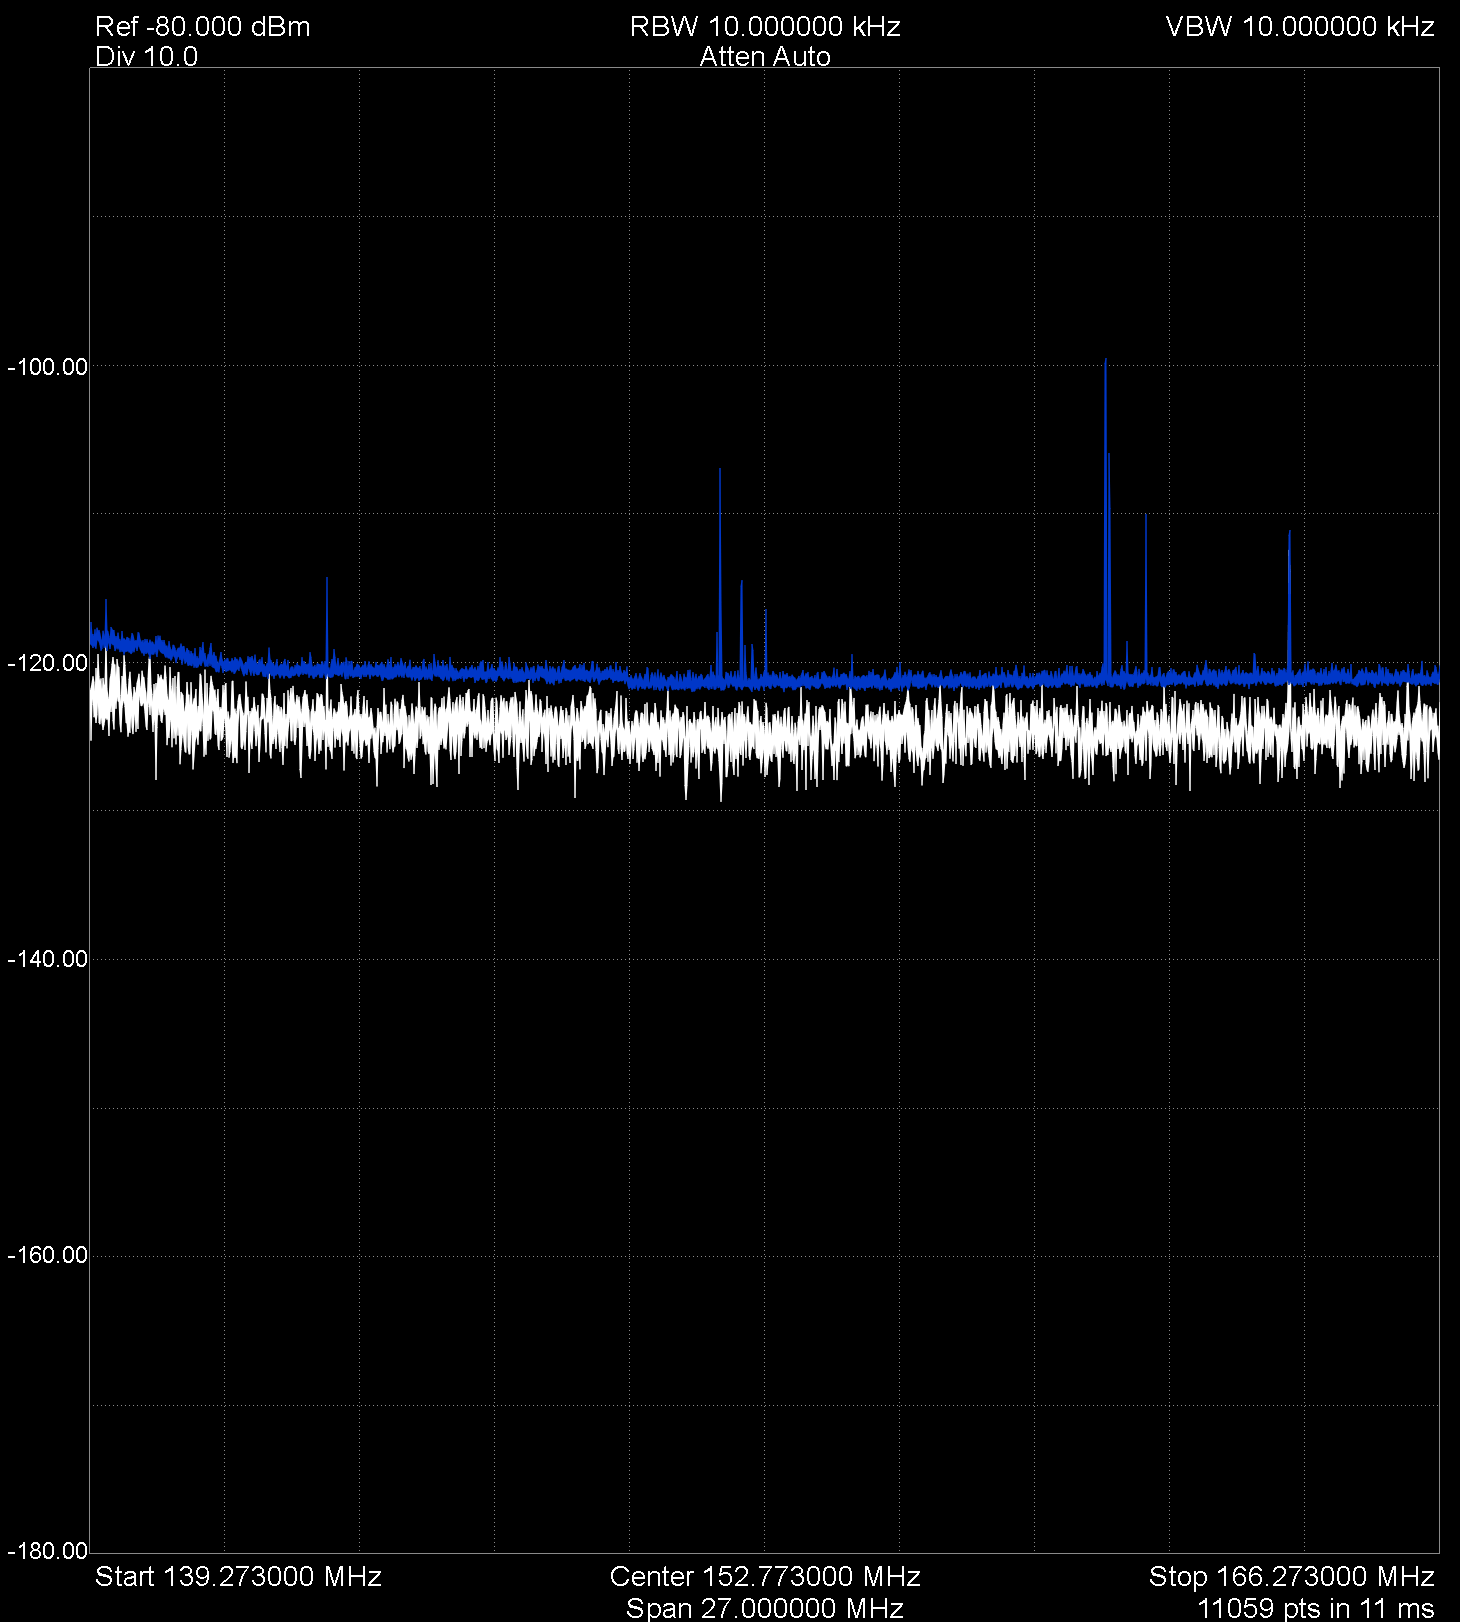
A Max Hold trace can provide a fast sweep over a wide frequency range that reveals anomalies and intermittent spurious signals, which may normally be missed in a rapidly updated frequency sweep display.
For example, limit lines can be configured to capture any frequency ranges that may have spurs beyond the threshold set by the standard. That frequency region can then be studied against the standard requirements to discover if it truly violates the standard limitations. Though this may not be the most ideal method, in many cases, this may provide the necessary insight during design and prototyping to prepare a design for more rigorous EMC precompliance testing.
Peak Amplitude & Quasi-Peak
ANSI and CISPR standards require a quasi-peak detection mode to be used during EMC precompliance evaluations. Though a quasi-peak detector is traditionally an analog circuit, digital reproduction of the circuit’s capability is possible. Nevertheless, this is somewhat of a complex mathematical task. Where applicable, the peak amplitude can be used instead, which is guaranteed to be higher than the quasi-peak detector amplitude. However, this may require more stringent measures to ensure enough margin in reduced emissions.
| Quasi-Peak Detector Defined By CISPR 16.1 & ANSI C63.2 Standards | ||
|---|---|---|
| Frequency | Charge Time Constant | Discharge Time Constant |
| 10 – 150 kHz | 45 ms | 500 ms |
| 150 kHz – 30 MHz | 1 ms | 160 ms |
| 30 MHz – 1 GHz | 1 ms | 550 ms |
Spike’s latest update enables a Bar Meter plot alongside a Frequency Scan Display. The bar meter plot contains a digital quasi-peak detection meter that shows the max and current quasi-peak at the center frequency and within the frequencies. The Bar Meter Plot also contains the peak and average power presented in the signal ranges of interest.
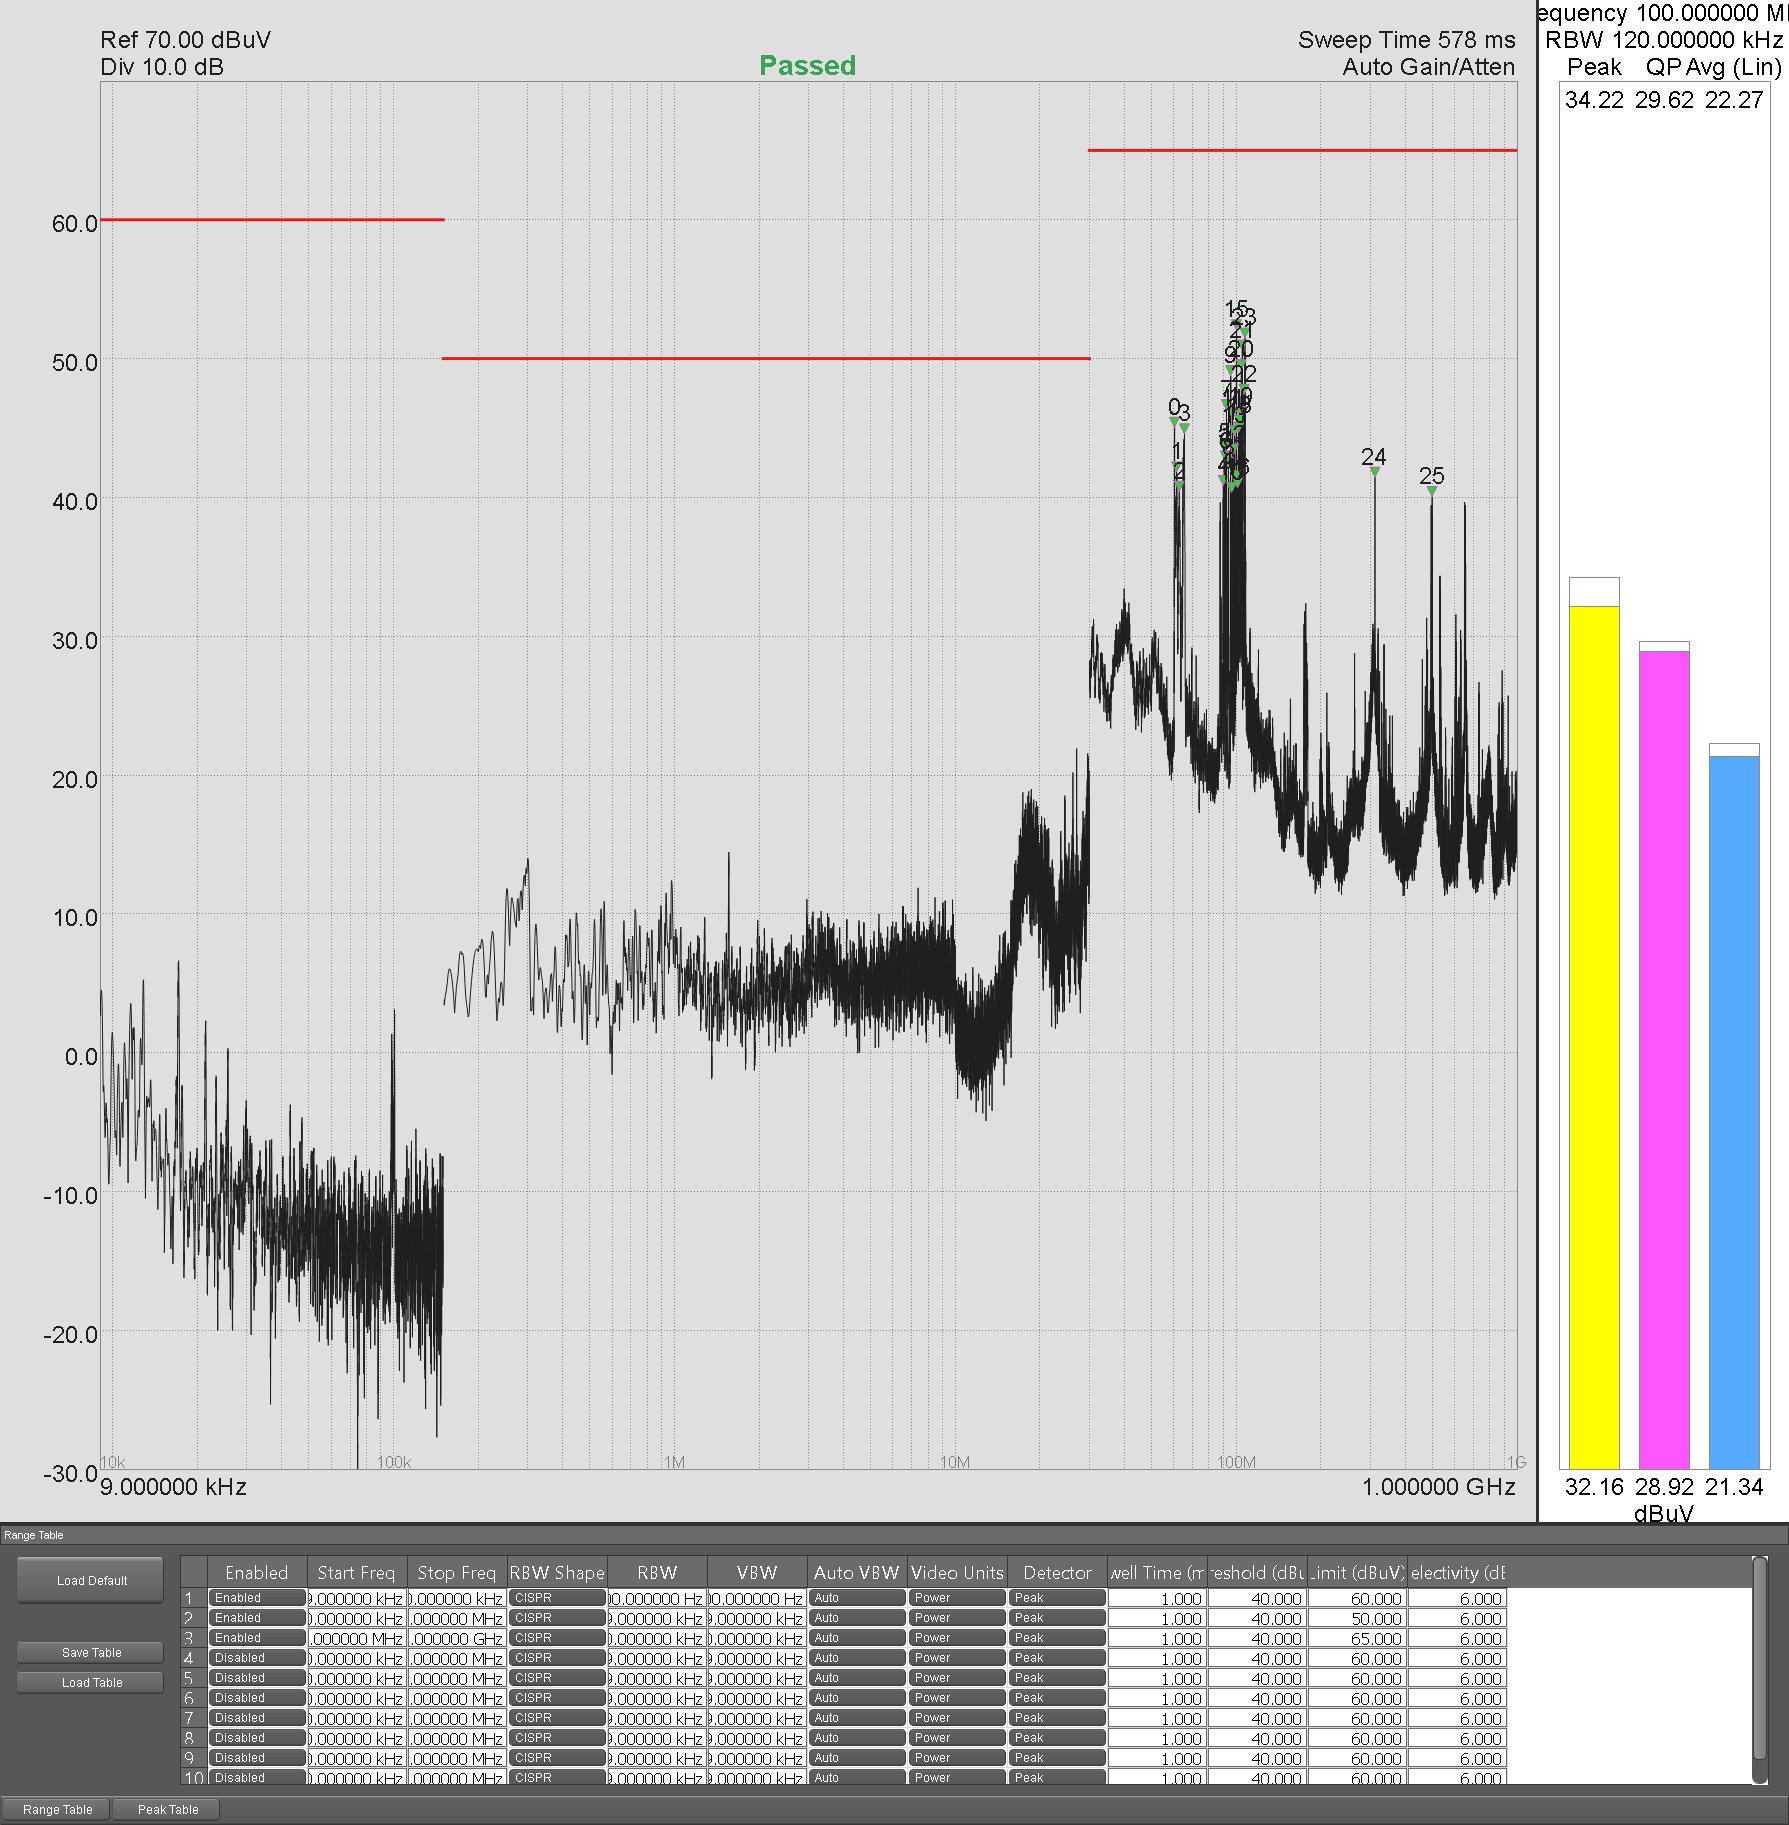
In a bar meter display of peak, quasi-peak, and average voltage reading, the peak reading will always be higher than the quasi-peak reading.
Frequency Sweeps & Spur Sweeps
An EMC precompliance meter or software will come equipped with a Frequency Scan Display, that will have standards settings for each frequency sweep pre-programmed and displayed with a few simple option selections. Without such software or an expensive EMC precompliance meter, each frequency sweep can be programmed and made separately.
| CISPR 16-1-1 Bandwidth, RBW, & Frequency Range | |||
|---|---|---|---|
| Band | Frequency Range | Bandwidth (6dB) | RBW |
| A | 9 – 150 kHz | 100 – 300 Hz | 200 Hz |
| Band | 0.15 – 30 MHz | 8 – 10 kHz | 9 kHz |
| C + D | 30 – 1000 MHz | 100 – 500 kHz | 120 kHz |
| E | 1 – 18 GHz | 300 – 2000 kHz | 1 MHz |
| ANSI C63.2 BWs & Frequencies For Peak, Average, & RMS Detectors | |
|---|---|
| Frequency | Bandwidth |
| 10 Hz – 20 kHz | 10, 100, and 1000 Hz |
| 10 – 150 kHz | 1 and 10 kHz |
| 150 kHz – 30 MHz | 1 and 10 kHz |
| 30 MHz – 1 GHz | 10 and 100 kHz |
| 1 – 40 GHz | 0.1, 1.0 and 10 MHz |
| MIL-STD-461E Frequency Range & Bandwidths | |
|---|---|
| Frequency | Bandwidth |
| 30 Hz – 1 kHz | 10 Hz |
| 1 kHz – 10 kHz | 100 Hz |
| 10 kHz – 100 kHz | 1 kHz |
| 150 kHz – 30 MHz | 10 kHz |
| 30 MHz – 1 GHz | 100 kHz |
| 1 GHz + | 1 MHz |
The results of each sweep can be exported from the RTSA software—as a CSV file, for example— and displayed in separate plotting software. Spike’s new EMC Precompliance module is equipped with CISPR and ANSI standards and automatically produces a live spur table and marking capability.
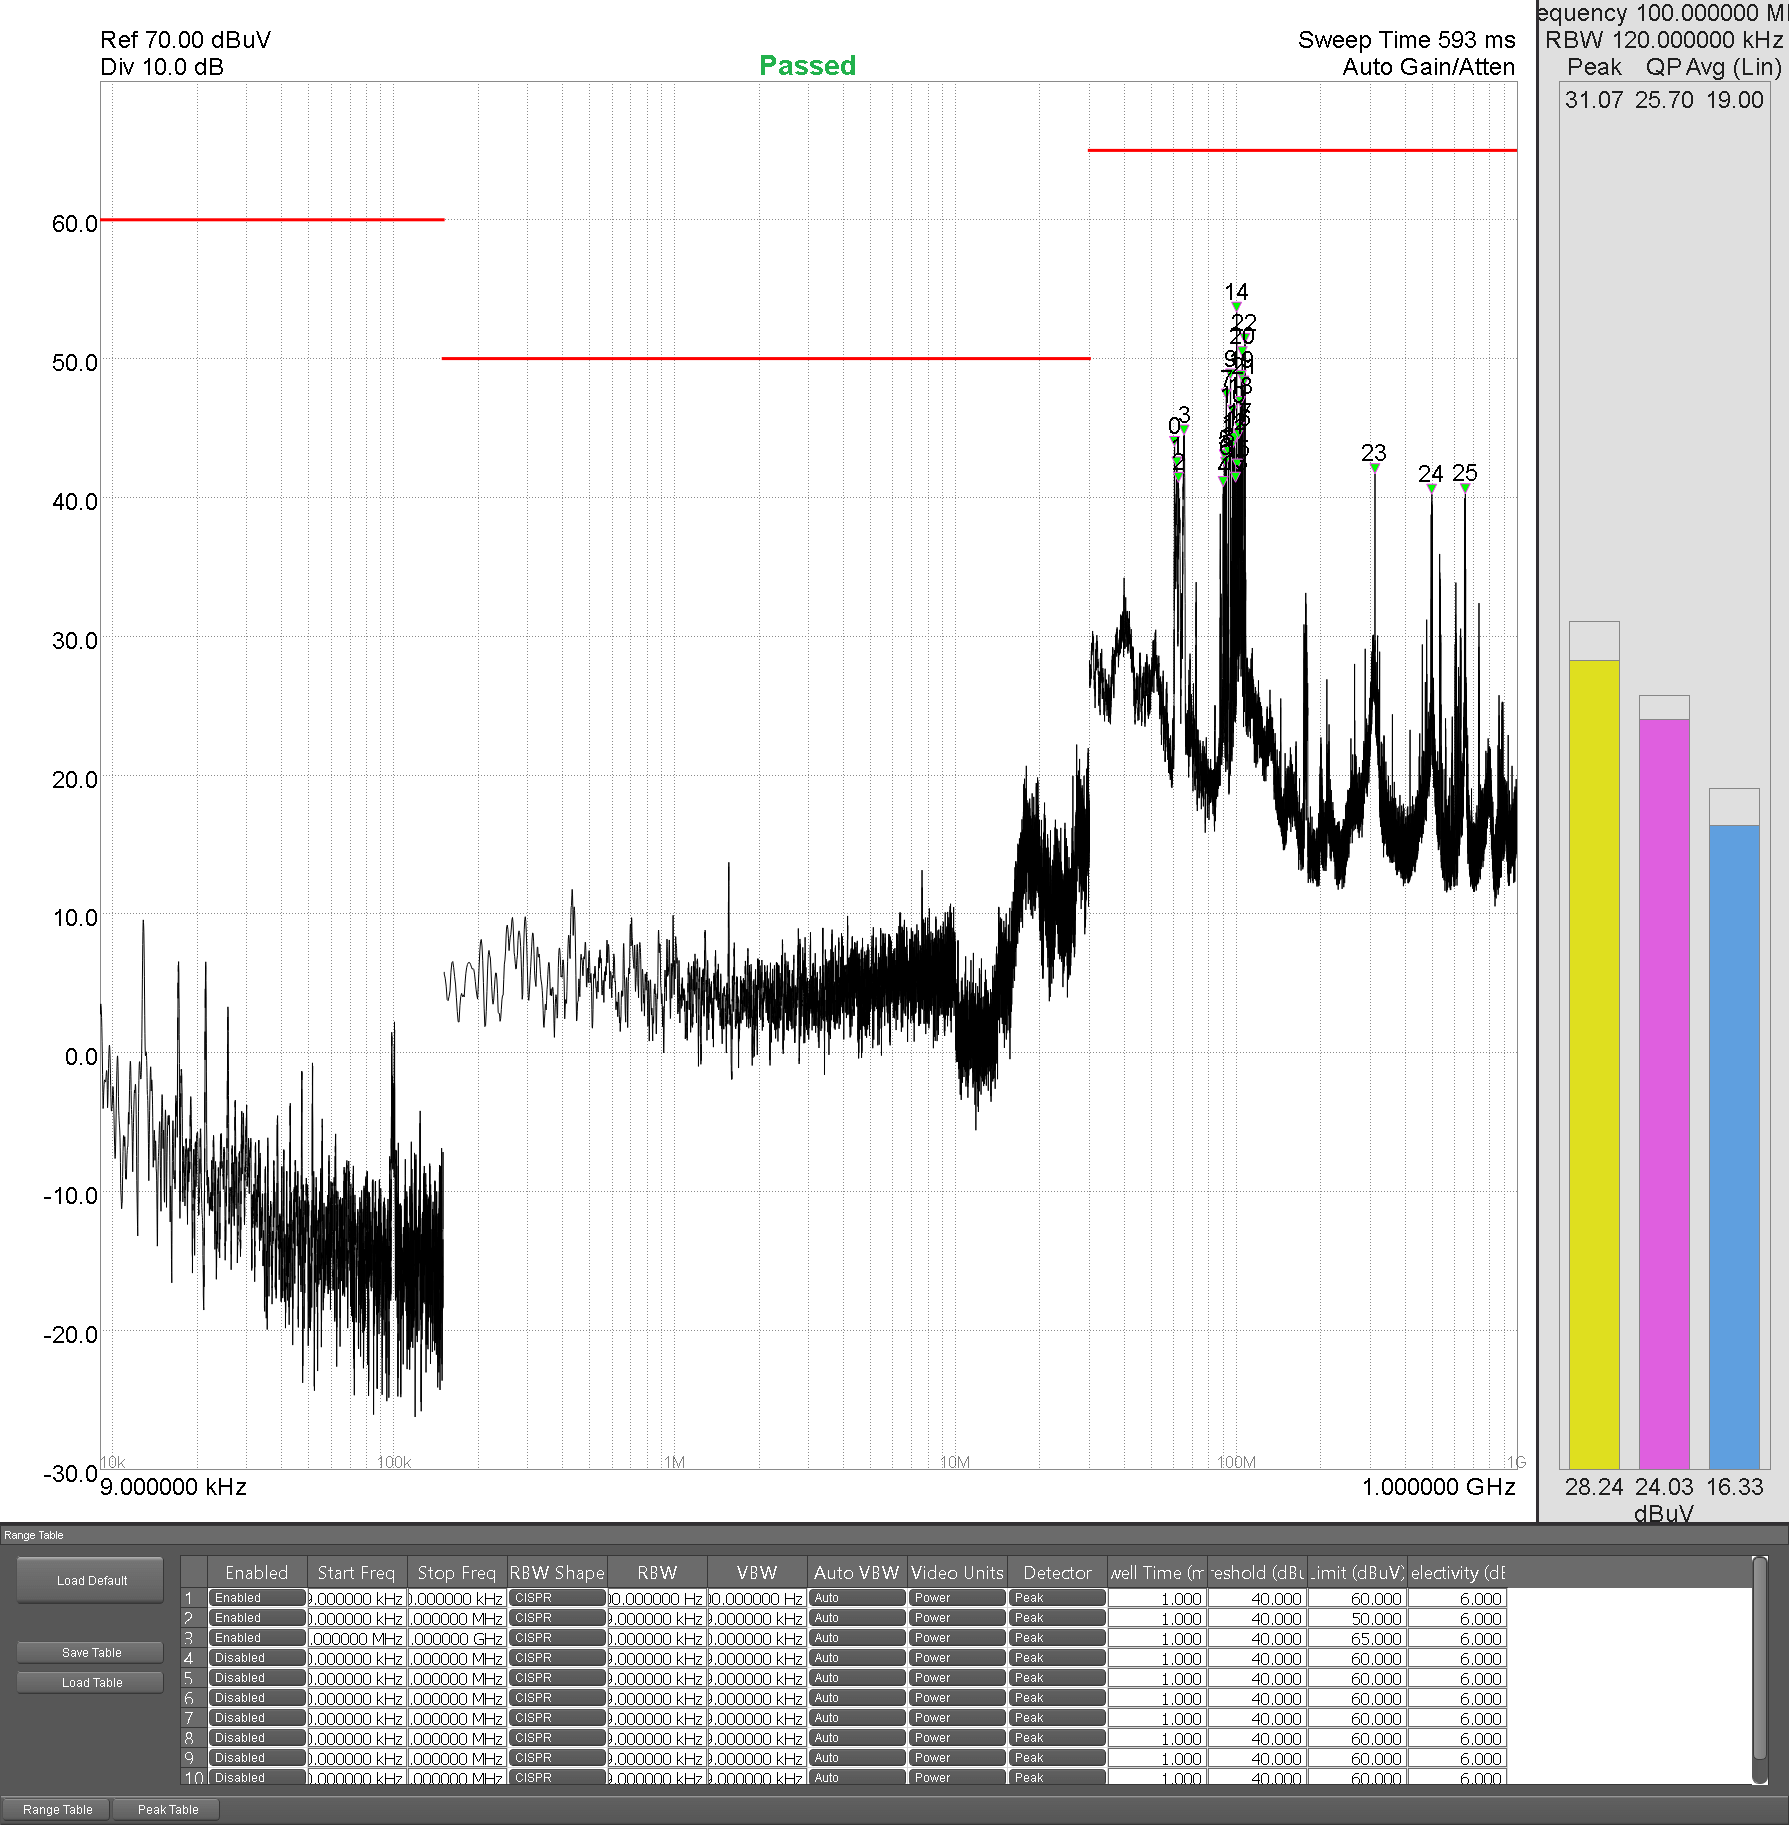
Spikes new EMC software module offers easily accessible Frequency Scan Displays for common standards, Bar Meter Plots with quasi-peak detector features, and a spur table display, all in one interface.
References
- www.tek.com/dl/37W_22084_1_MR_Letter.pdf
- www.tek.com/dl/37A_60141_1_HR_Letter.pdf
- https://www.rohde-schwarz.com/vn/applications/comparison-of-time-domain-scans-and-stepped-frequency-scans-in-emi-test-receivers-application-note_56280-54019.html
- http://literature.cdn.keysight.com/litweb/pdf/5989-6899EN.pdf?id=1203888
- http://cp.literature.agilent.com/litweb/pdf/5968-3661E.pdf
- http://www.keysight.com/main/eventDetail.jspx?cc=US&lc=eng&ckey=2462479&nid=-35261.685629.08&pid=1147919
- http://www.emcfastpass.com/pre-compliance-testing-guide/
- http://www.feebel.be/en/system/files/FEE%20131016%20EMC%20Diagnostics_0.pdf
- http://www.testforce.com/testforce_files/Practical_EMI_Measurements.pdf
- http://www.emcfastpass.com/wp-content/uploads/2015/04/Getting_EMC_Right_First_Time_Intro.pdf
- https://signalhound.com/support/forums/topic/bb60-for-emc/
- http://www.edn.com/electronics-blogs/the-emc-blog/4429621/Using-current-probes-to-estimate-E-fields
- http://incompliancemag.com/article/lessons-learned-from-the-design-and-construction-of-an-open-area-test-site-oats-and-sound-measurement-building/
- http://www.emcs.org/acstrial/newsletters/summer08/pp2.pdf
- http://www.hottconsultants.com/techtips/tips-cm.html
- http://www.emcfastpass.com/top-emc-failures-and-tips-from-5-emc-consultants/
- http://www.emcfastpass.com/avoid-the-most-common-failures-with-these-7-essential-emc-design-rules/
- http://www.emcfastpass.com/emc-design-review/
- http://www.emcfastpass.com/emc-test-equipment-guide/
- http://www.emcfastpass.com/emc-testing-beginners-guide/
- https://www.ieee.li/pdf/viewgraphs/emc_design_fundamentals.pdf
- https://www.ieee.li/pdf/essay/guide_to_global_emc_requirements_2007.pdf
