In this article, we’re diving into the intricacies of Swept Analysis Mode in our Spike spectrum analyzer software, shedding light on its significance for RF engineers. Understanding this mode is crucial for effective spectrum analysis, regardless of which RF analyzer or analysis software you use. However, we’re specifically working with Signal Hound RF equipment and Spike software for this article.
You can watch Signal Hound President, Tom Lane, work through this demonstration in real-time in this video:
Or, feel free to read on, below!
Introduction – The Basics of Swept Analysis Mode
Swept spectrum analysis is a technique commonly employed in RF (radio frequency) analysis to comprehensively examine a signal’s frequency spectrum. Unlike traditional spectrum analyzers, which capture a snapshot of the spectrum at a specific moment, swept spectrum analysis involves continuously sweeping through a range of frequencies to detect and analyze signals dynamically. This method allows for a more thorough investigation of RF environments, aiding in the identification and characterization of various signals, including potential interference or undesired emissions.
In the realm of spectrum analyzers, Swept Analysis Mode takes center stage. It’s the go-to mode for most RF engineers, displaying the FFT plot of the spectrum within the designated span window.
Auto Triggering and Initialization
To begin with, connect your RF analyzer to a computer running Spike software.
Upon launching Spike, the software detects and configures the connected spectrum analyzer. It automatically determines the device’s bandwidth and sets the center frequency.
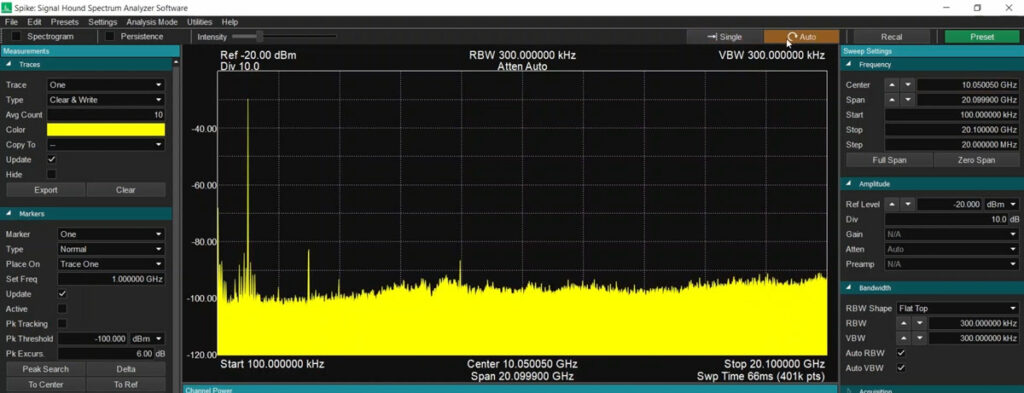
Auto-triggering, or continuous trigger mode, kicks in during startup, revealing the RF spectrum as perceived by the connected device.
Navigating Swept Analysis Mode
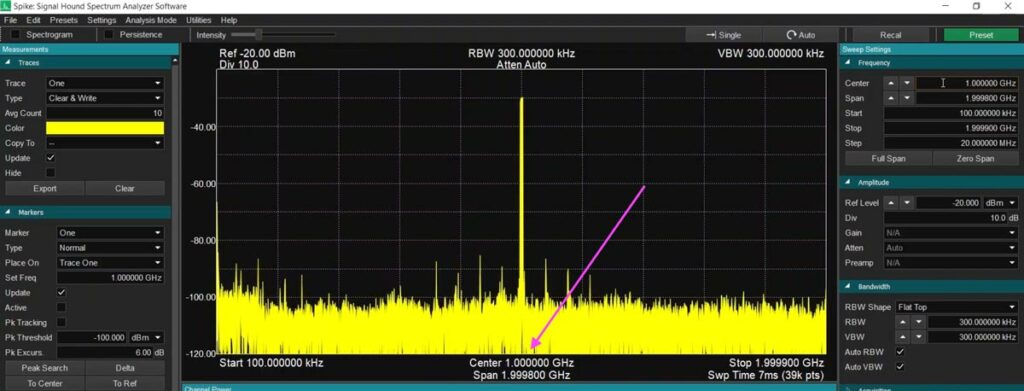
The spectrum unfolds, showcasing the noise floor and signals rising above it. The screenshot below depicts a spectrum centered around 1 GHz:
Note Spike’s Single and Auto triggering modes:
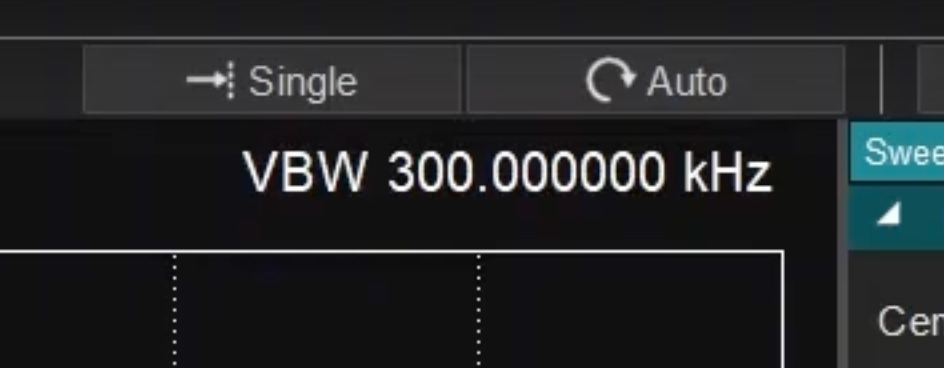
Single mode allows you to capture an image of the spectrum at one specific point in time. In contrast, Auto mode allows for a continuously updating view of the RF spectrum in range.
Setting Up Swept Analysis
For a comprehensive sweep analysis, start by adjusting the frequency settings:
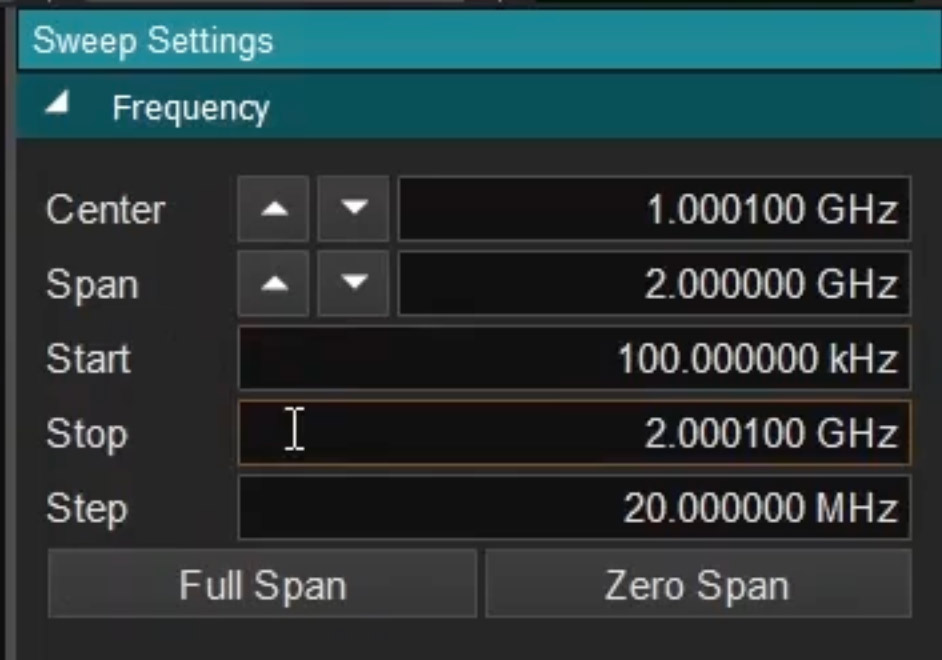
- Set the center frequency (e.g., 1 GHz, as shown earlier)
- Define the span (region to sweep across)
- Modify start and stop frequencies
- Adjust step size for center frequency (dictates how much the Center Frequency control buttons move on each click)
Fine-Tuning Amplitude Settings
Moving to amplitude settings, set the key parameters of your desired measurement:
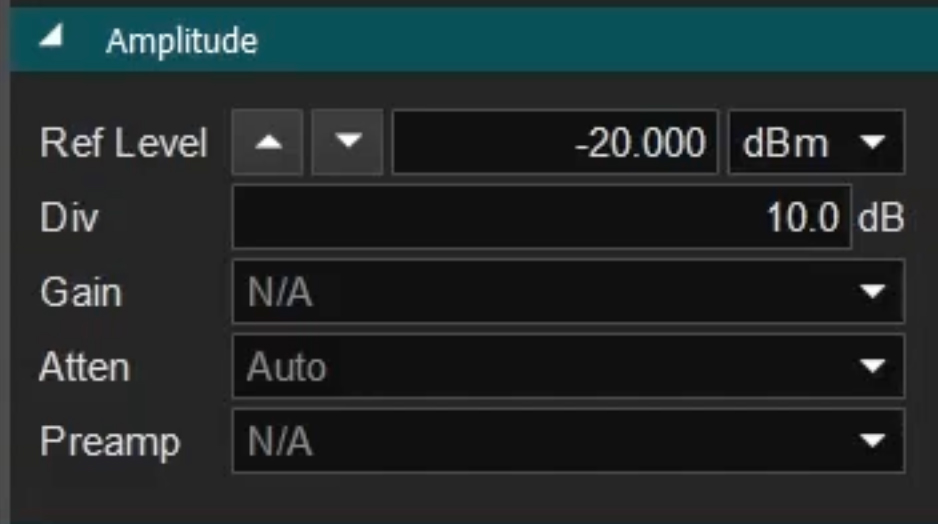
- Reference level (default at -20 dBm)
- Units (dBm, dB microvolts, etc.)
- Division per graticule (default at 10 dB steps)
- Gain and attenuation adjustments (if supported)
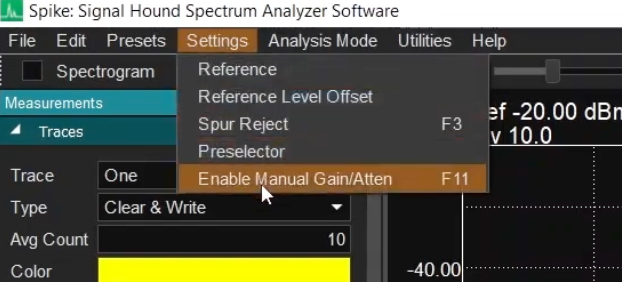
If the analyzer supports the functionality, you can adjust manual gain and attenuation (in devices like the SM200C) via the Settings menu:
Mastering Resolution Bandwidth
Crucial to spectrum analysis is the resolution bandwidth. Resolution bandwidth settings balance signal resolution, sweep time, and the number of points in the FFT – adjusting this setting during your analysis session refines the on-screen data in real-time.
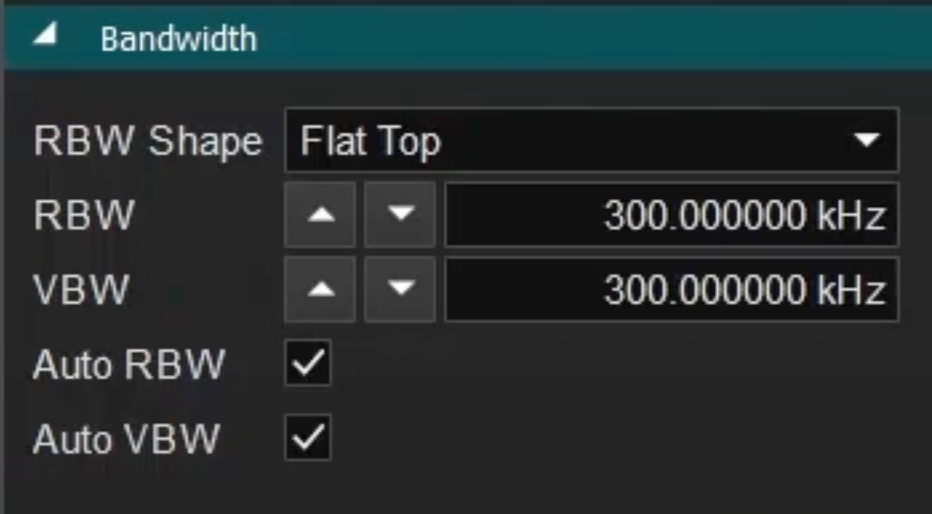
You’ll need to manipulate this setting to find the optimal plot for your application. The demonstration maintains a default setting, but engineers can customize it based on their specific requirements.
Conclusion – Explore the Spectrum with Confidence
Possessing a thorough understanding of Swept Analysis Mode is the linchpin for RF engineers seeking a detailed spectrum view. This article helps you better understand the intricacies of setting up and navigating this powerful mode.
Have questions or insights? Drop them in the comments below – and remember to check out our YouTube channel and subscribe for technical videos related to our products and RF content.
Until next time, happy exploring!
