In our latest Tech Brief, 7 Reasons You’re Paying Too Much for Your Spectrum Analyzer, we write about how a company may be spending too much money on test and measurement equipment for features they may be able to find in RF test devices that cost much less.
Accuracy is key
Many devices, subsystems, and systems require accurate phase noise measurements. Spectrum analyzers are commonly used for this measurement. However, the spectrum analyzer itself must have low enough phase noise so as not to contribute to the device measurement. While many test equipment vendors charge for phase noise measurement personalities, Signal Hound’s spectrum analysis software, Spike, includes phase noise measurement capability.
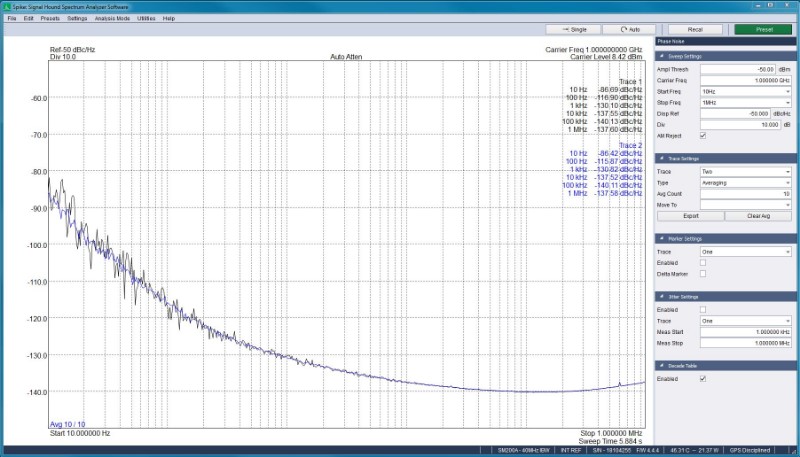
The Signal Hound SM200A uses a low IF architecture design that enables exceptional phase noise performance, comparable to the performance of a more expensive spectrum analyzer. The Signal Hound SA44 and BB60 use a more traditional superheterodyne architecture to achieve a more modest phase noise performance, but at an even more affordable price. Note that for the SA44, the results listed are typical as it does not have a hard spec for phase noise.
| Offset | SA44B (Typ.) | BB60C (Spec.) | SM200A (Spec.) | Keysight N9020B (Spec.) | Keysight N9020B (Typ.) |
|---|---|---|---|---|---|
| 10 Hz | -76 | -80 | |||
| 100 Hz | -80 | -70 | -108 | -91 | -100 |
| 1 kHz | -88 | -76 | -123 | -112 | |
| 10 kHz | -91 | -83 | -132 | -113 | -114 |
| 100 kHz | -100 | -93 | -136 | -116 | -117 |
| 1 MHz | -133 | -135 | -136 |
The low IF architecture of the SM200A enables phase noise performance with a lower cost design, but it does come with a trade-off of higher image response spurs. While the residual response spurs are comparable to the MXA, the image response spurs are not as good as the MXA (<-74 dBc).The SM200A Spike software provides a Signal ID feature to be activated and deactivated to allow low level mixer spurs to be differentiated from RF Input signals. In many cases the spurs can be identified as coming from the spectrum analyzer and not the device-under-test (DUT), allowing them to be ignored during the actual measurement. The more traditional superheterodyne architecture of the BB60C typically has -70 dBc image rejection. The BB60C spurs are generally not from the image response.
| Signal Hound SM200A | ||
|---|---|---|
| Frequency | Image Reject Off | Image Reject On |
| 100 kHz to 6 GHz | -58 dBc | -75 (typ) |
| 6 GHz to 10 GHz | -55 dBc | -75 (typ) |
| 10 GHz to 20 GHz | -44 dBc | -75 (typ) |
Want to see all 7 reasons?
Listen, we understand that it’s hard to believe that a lower-cost spectrum analyzer can provide high-quality RF analysis data – it sounds almost too good to be true. There are a few things that make sense, though, when you understand the reasons why our devices cost less. This tech brief helps clarify these reasons.
